Manitoba Fall Soil Moisture Survey
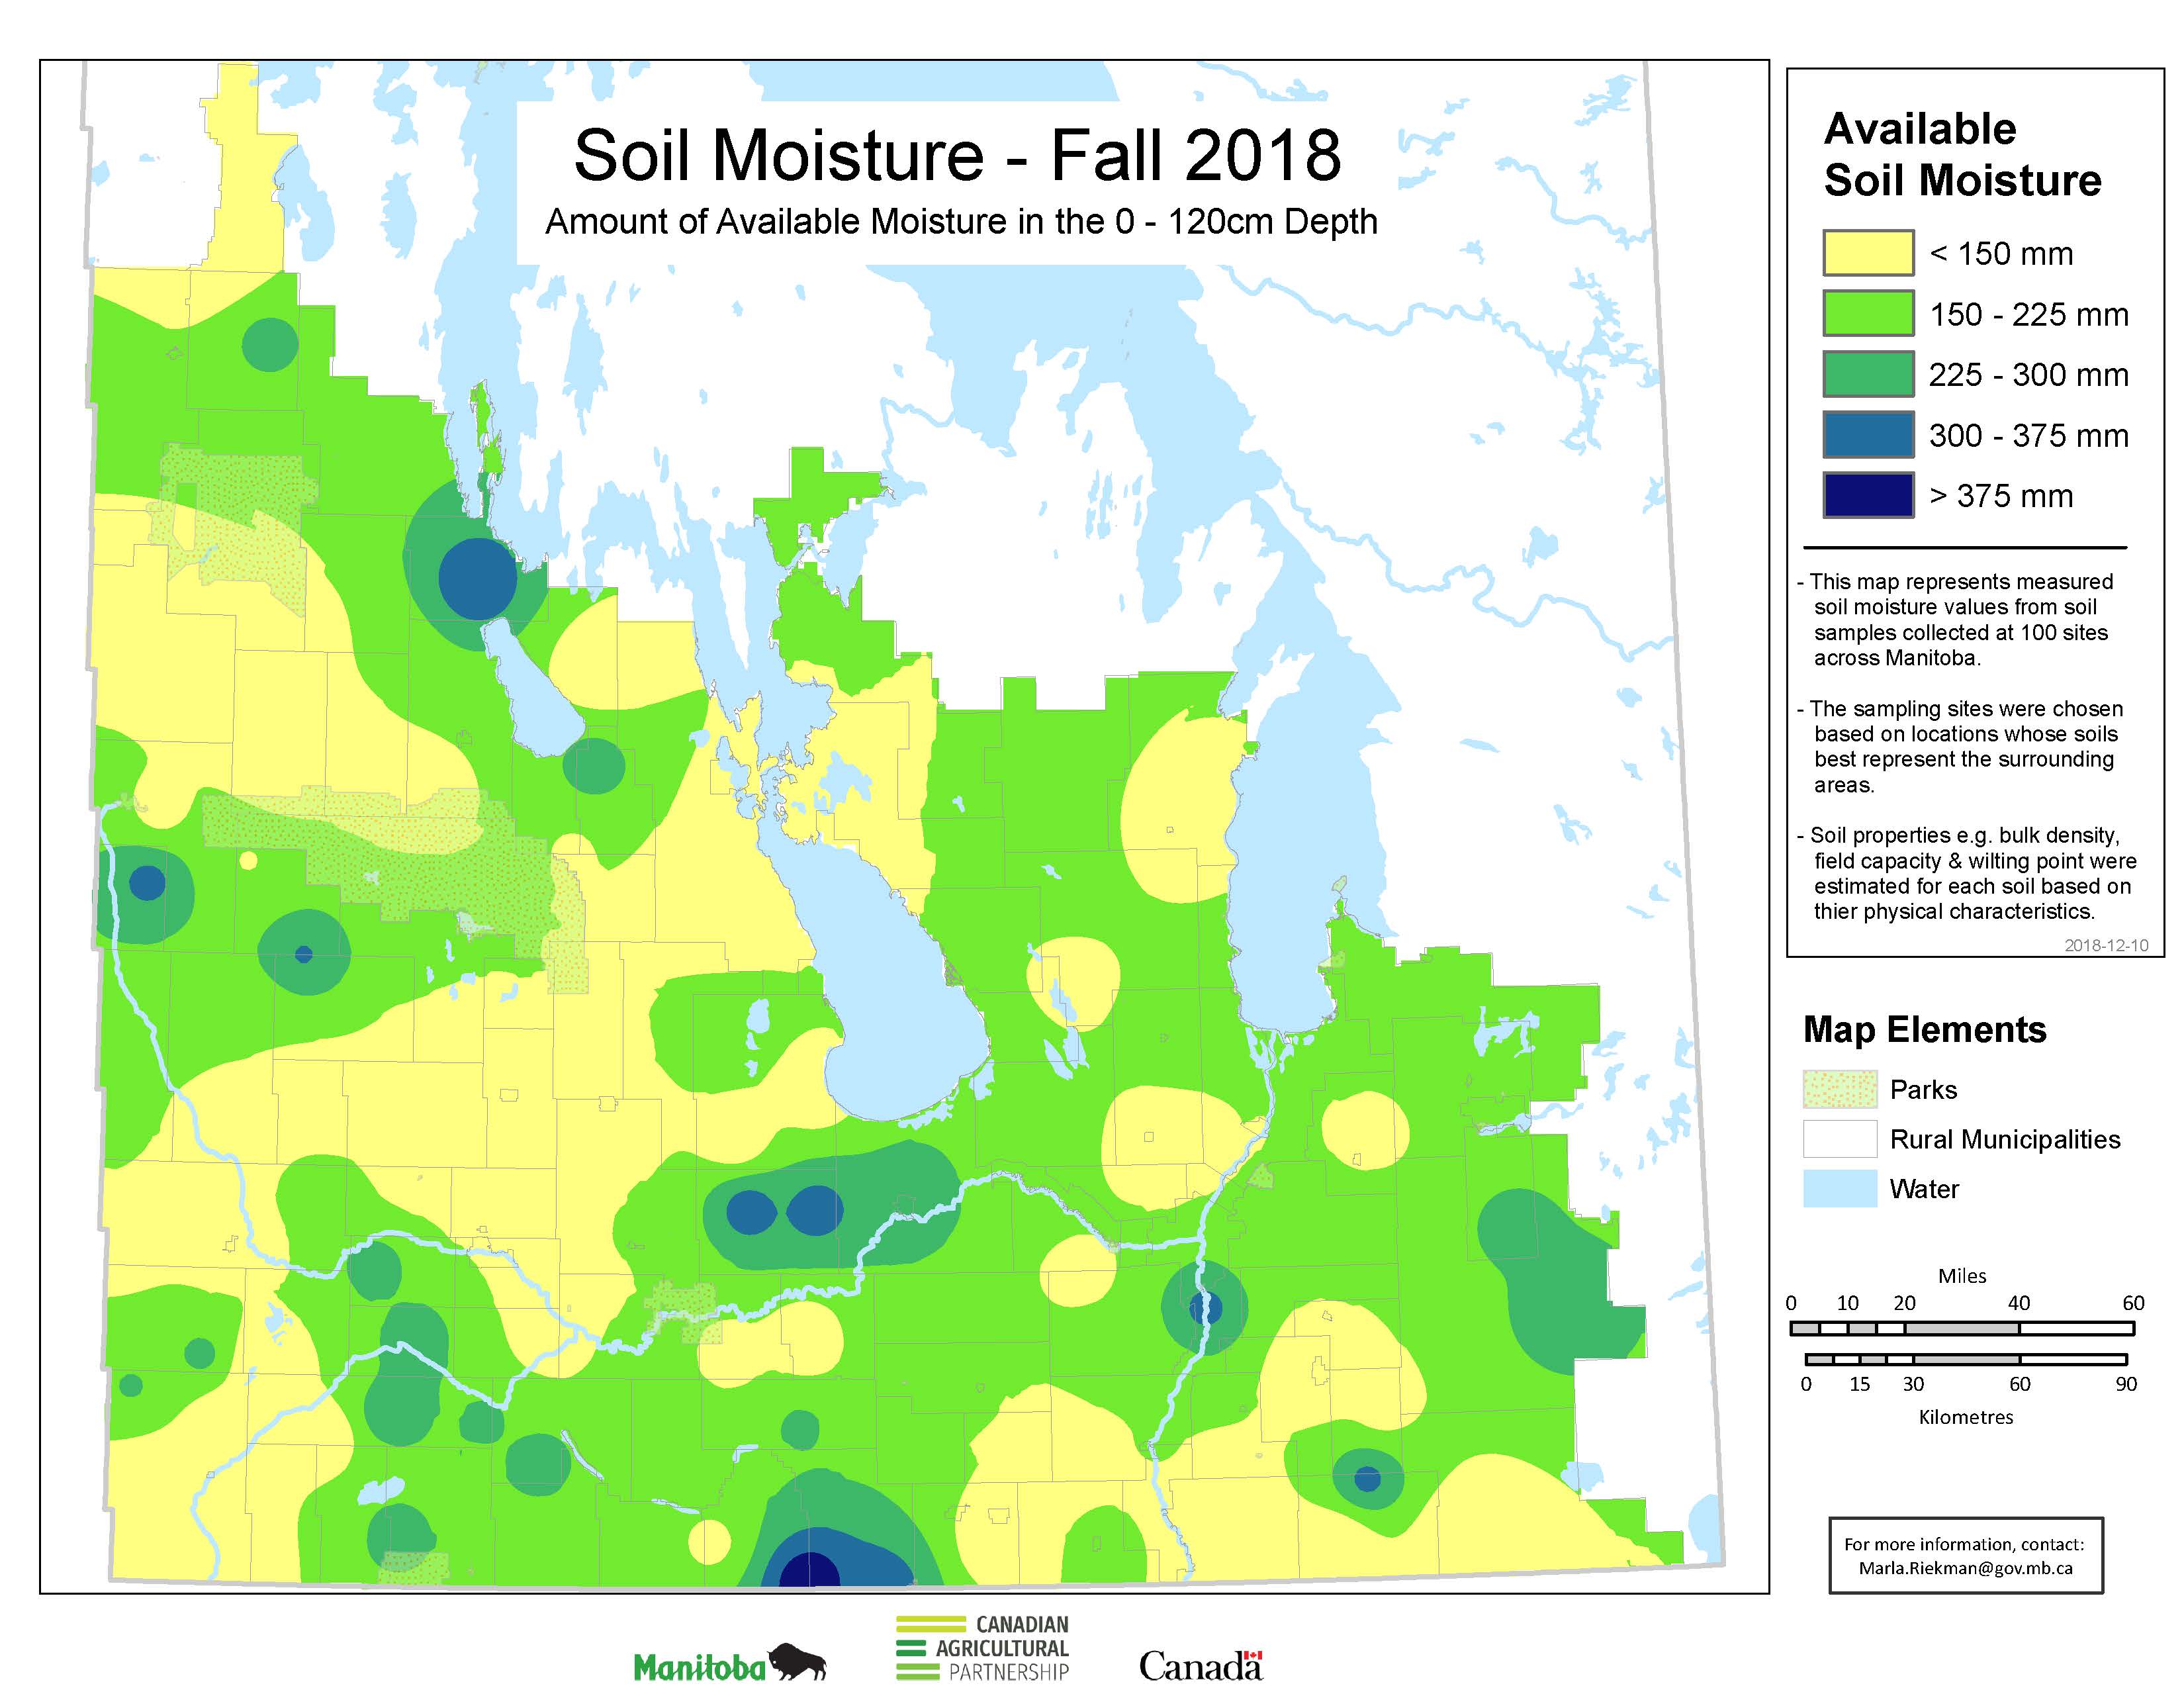
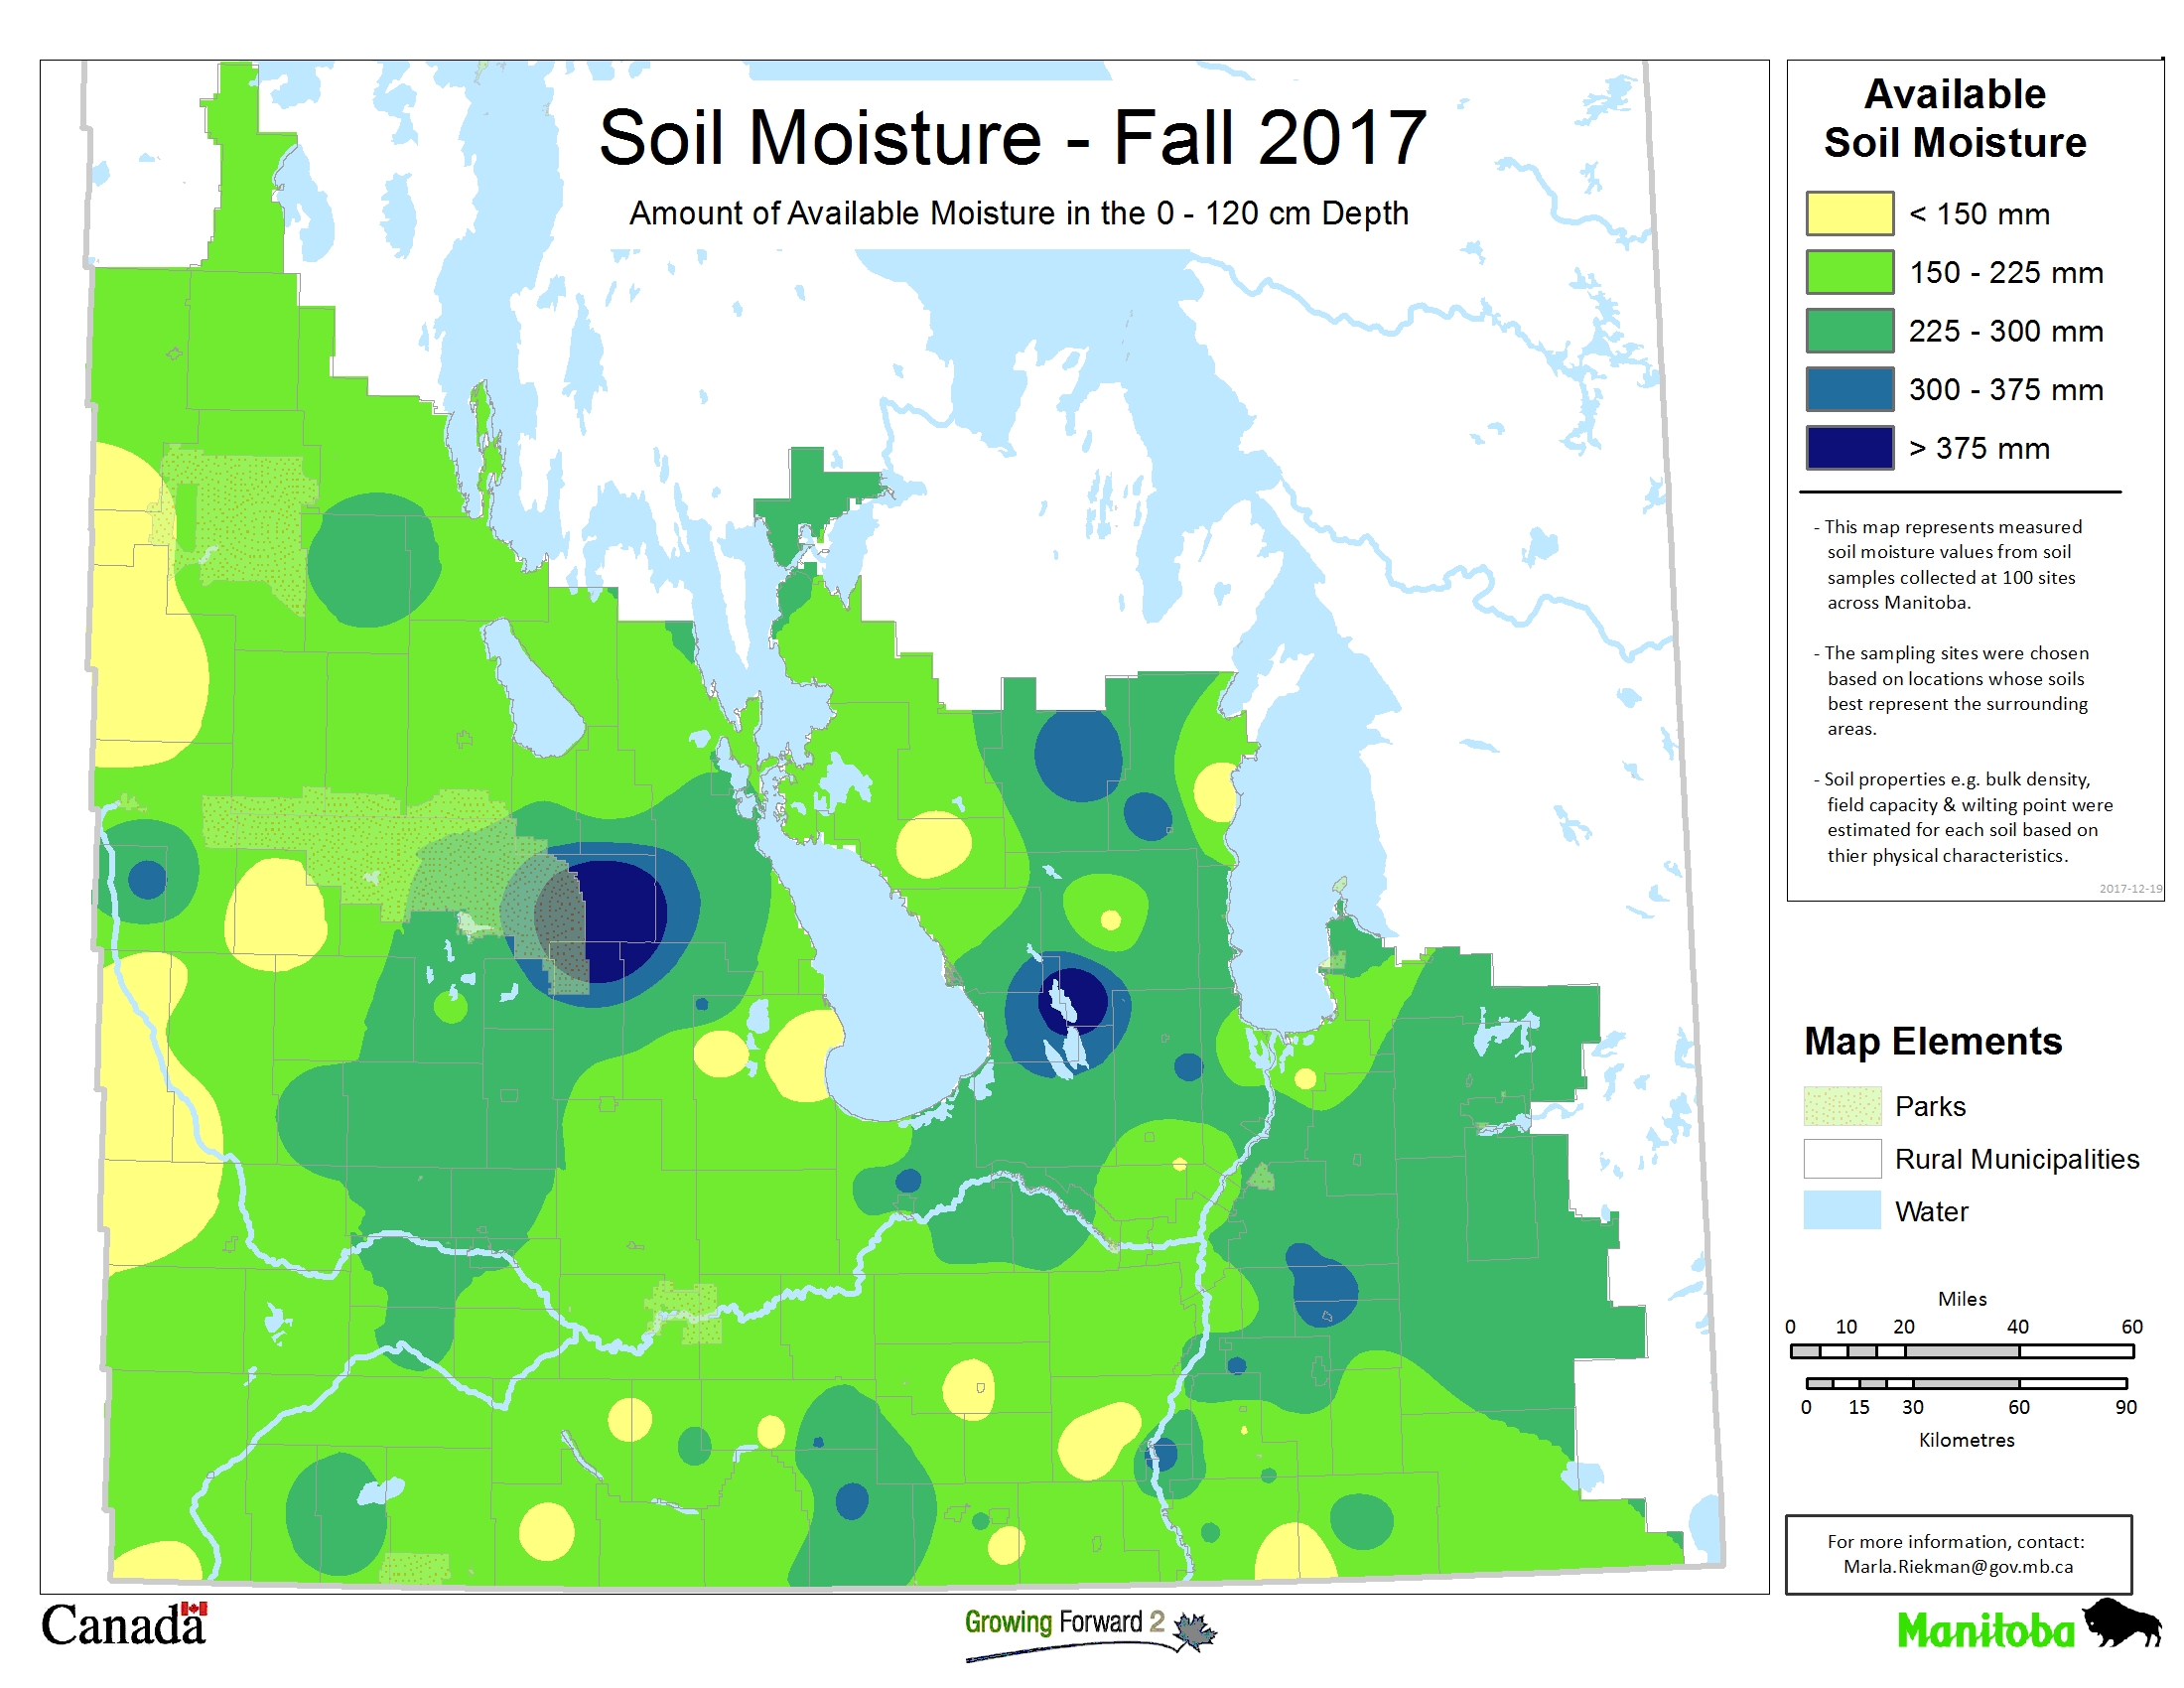
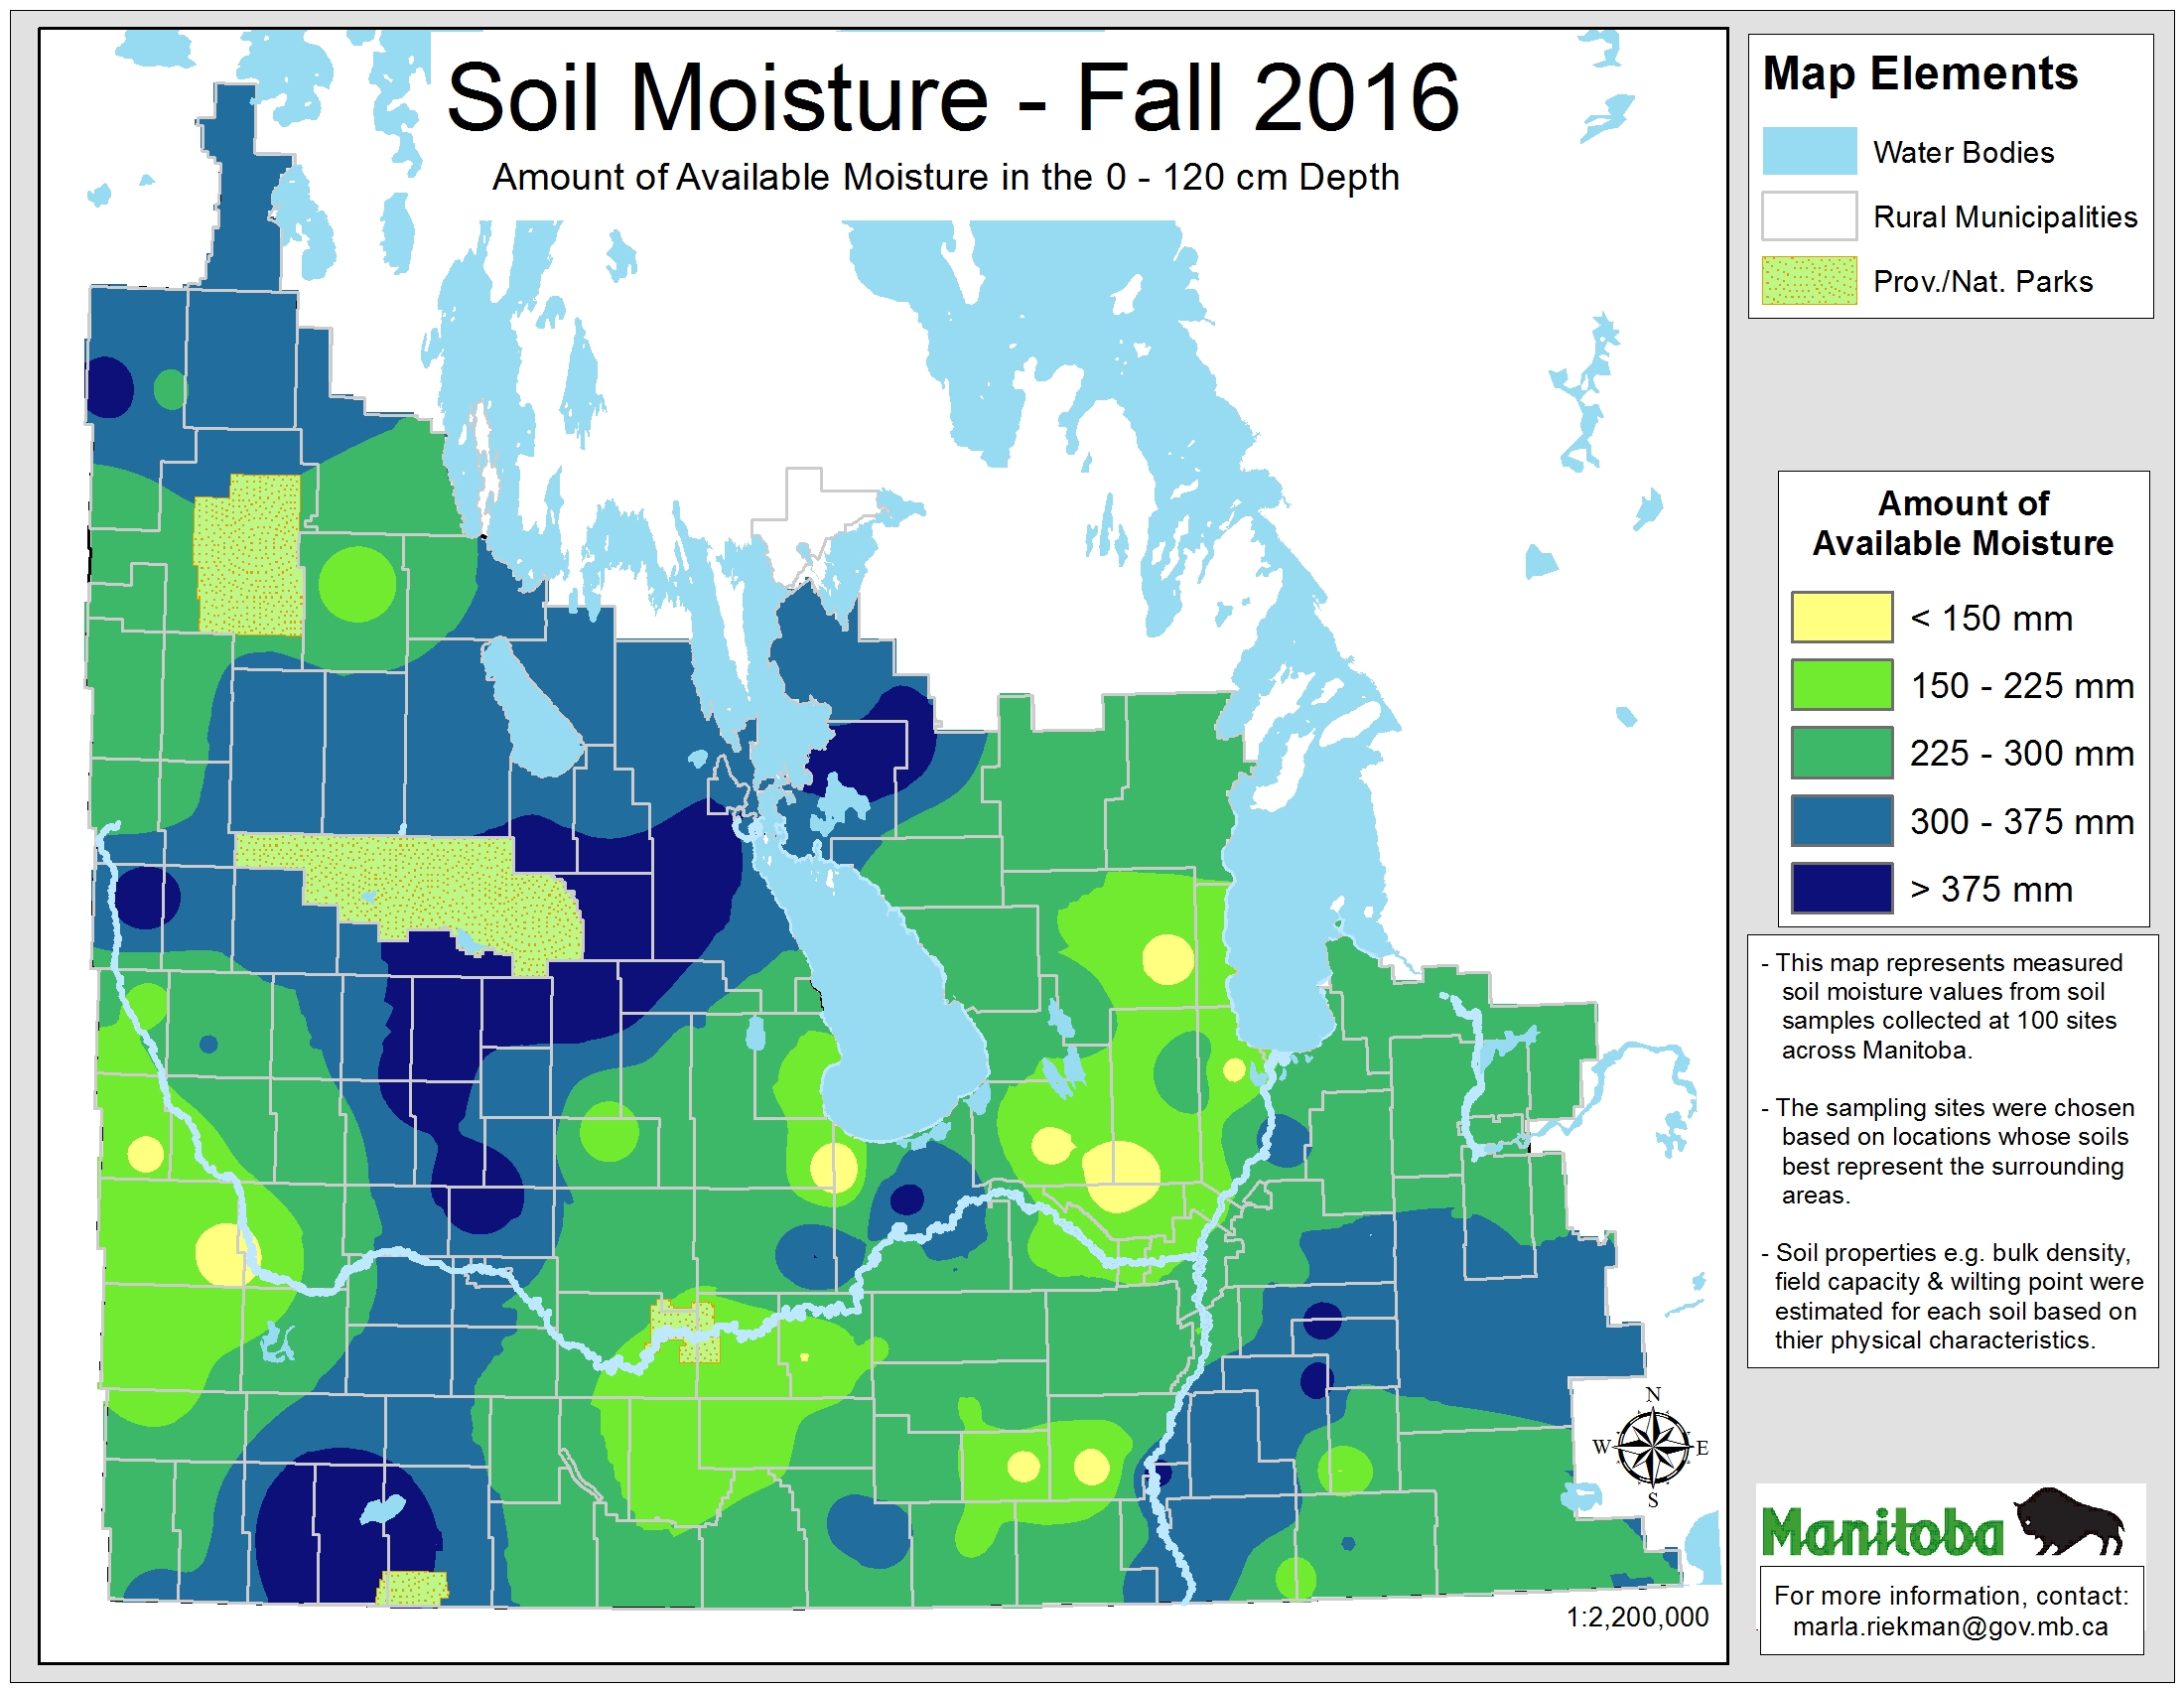
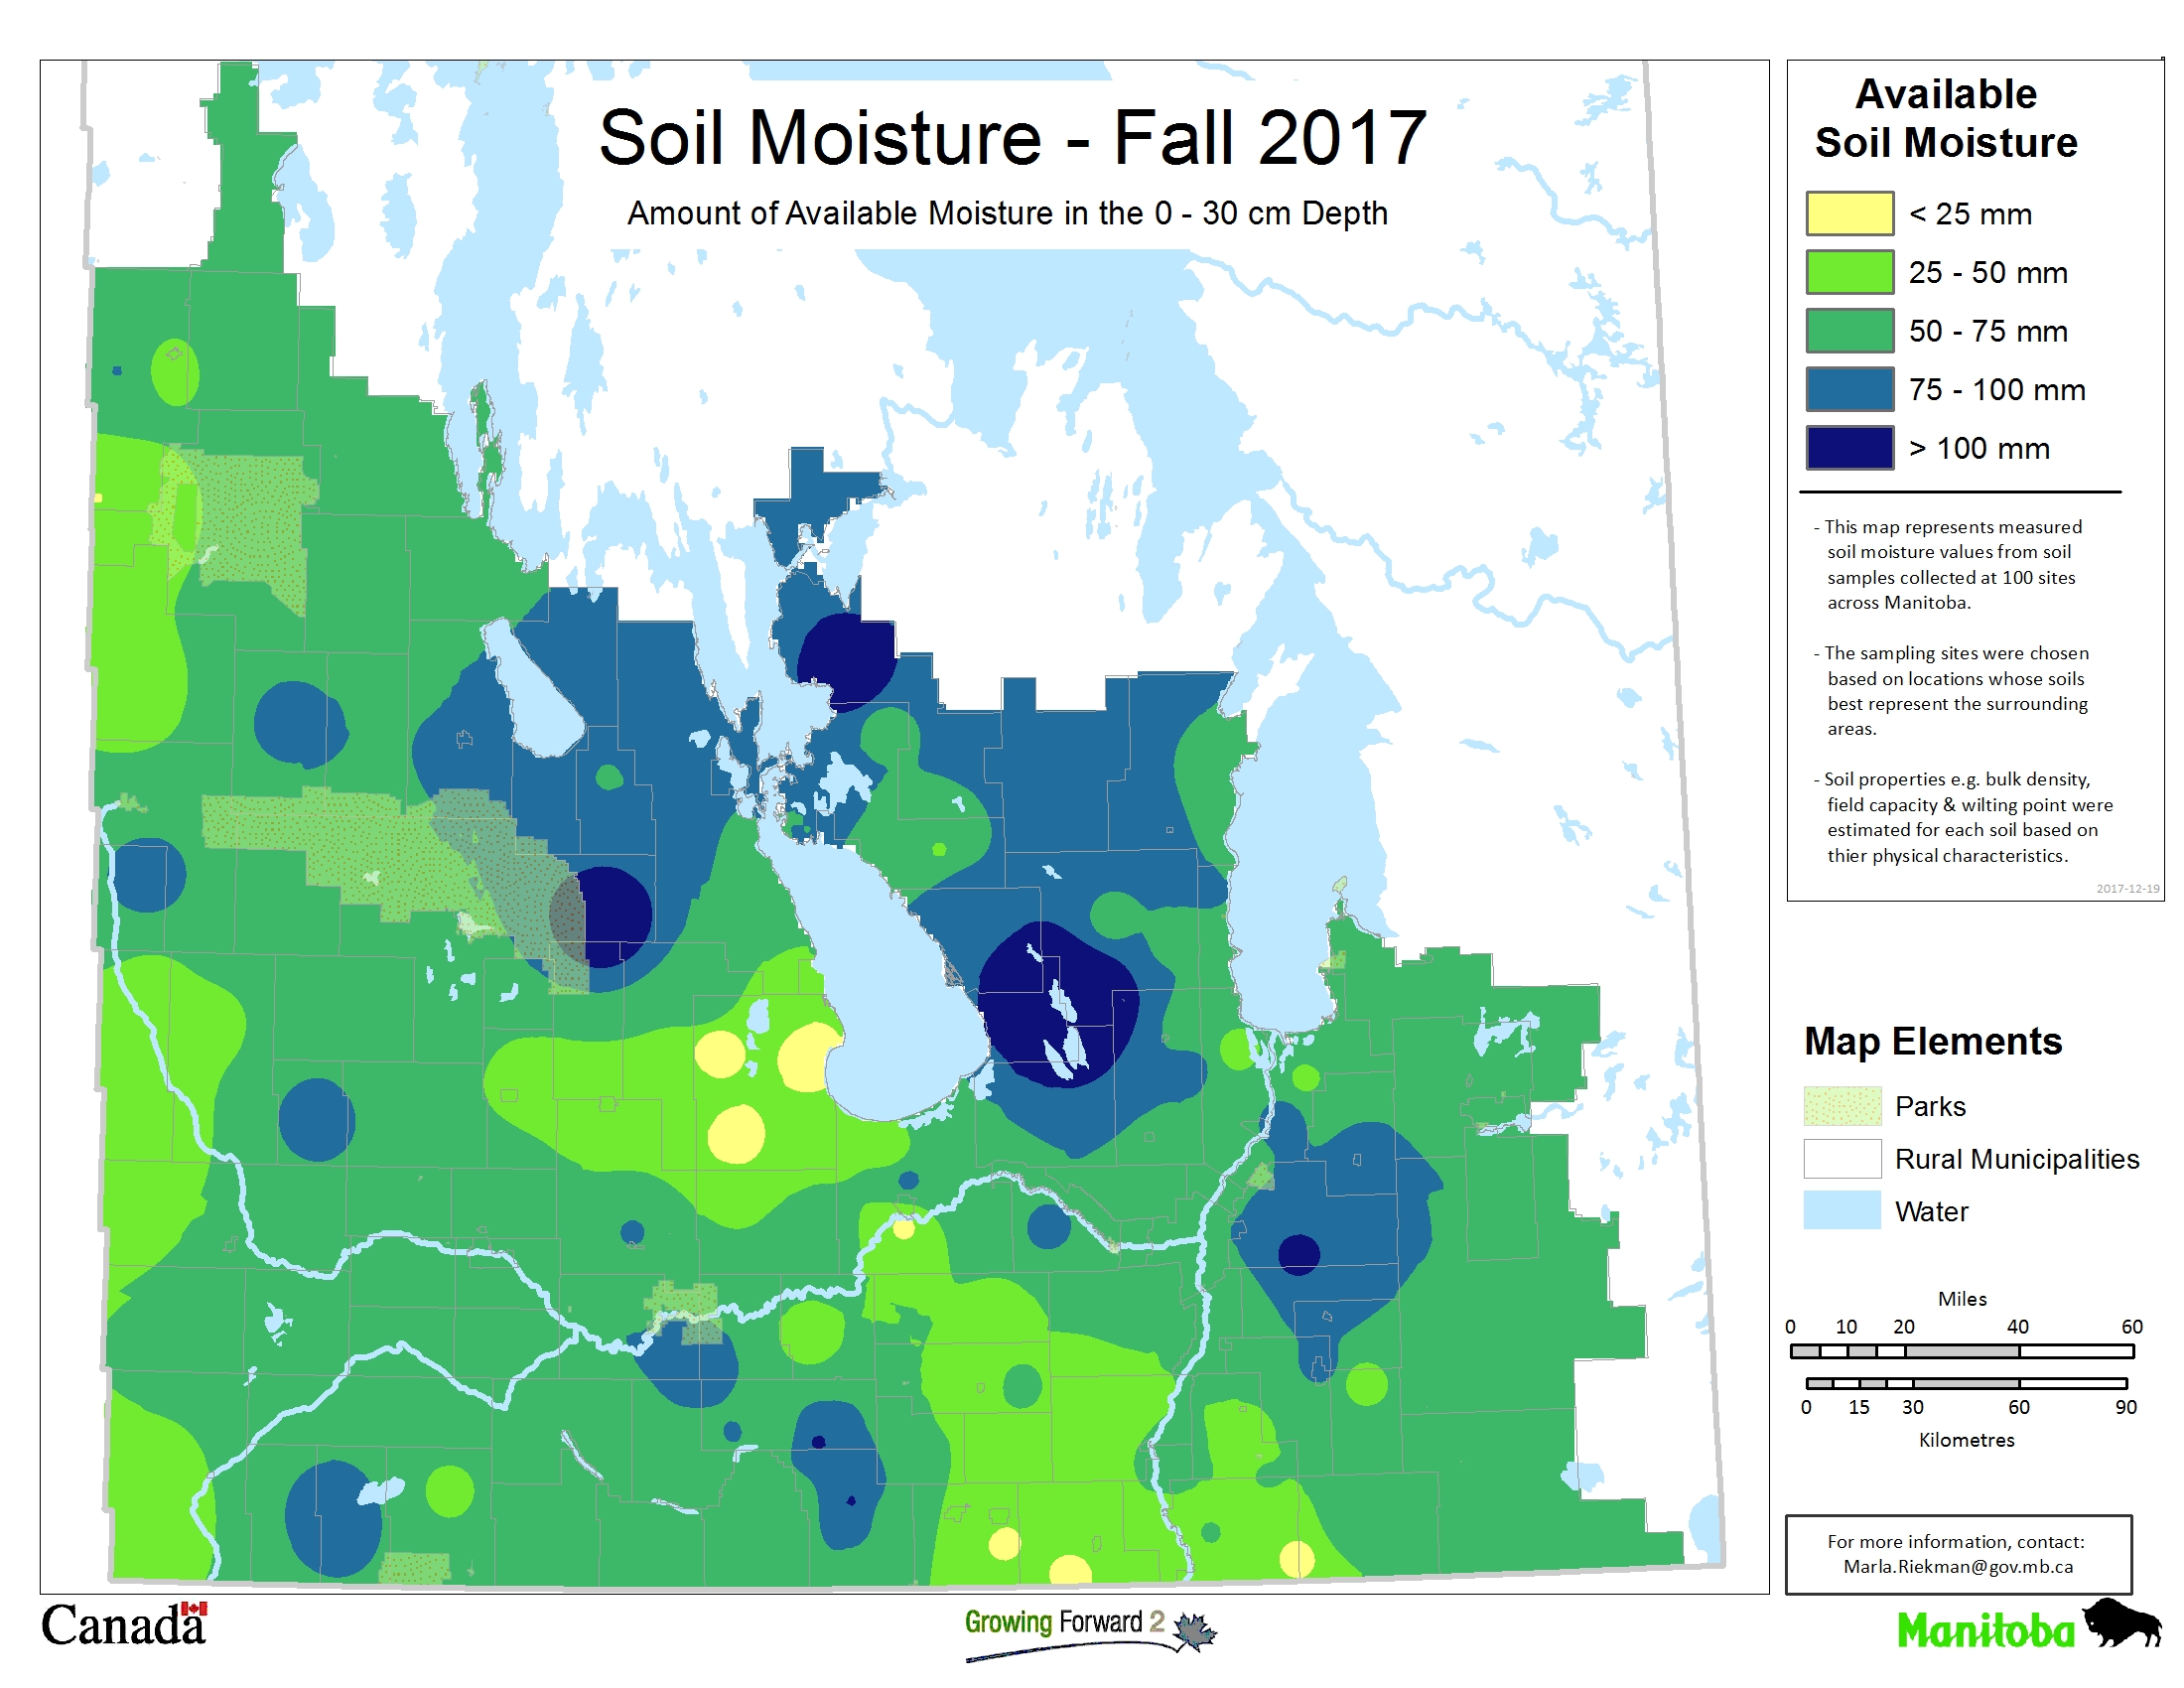
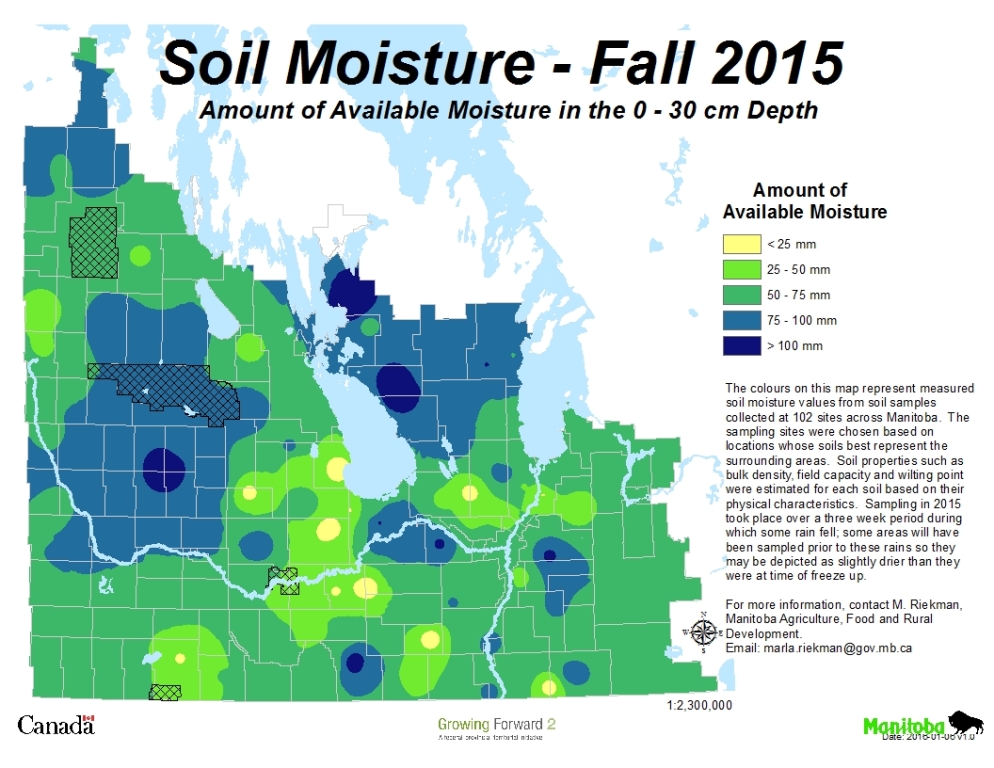
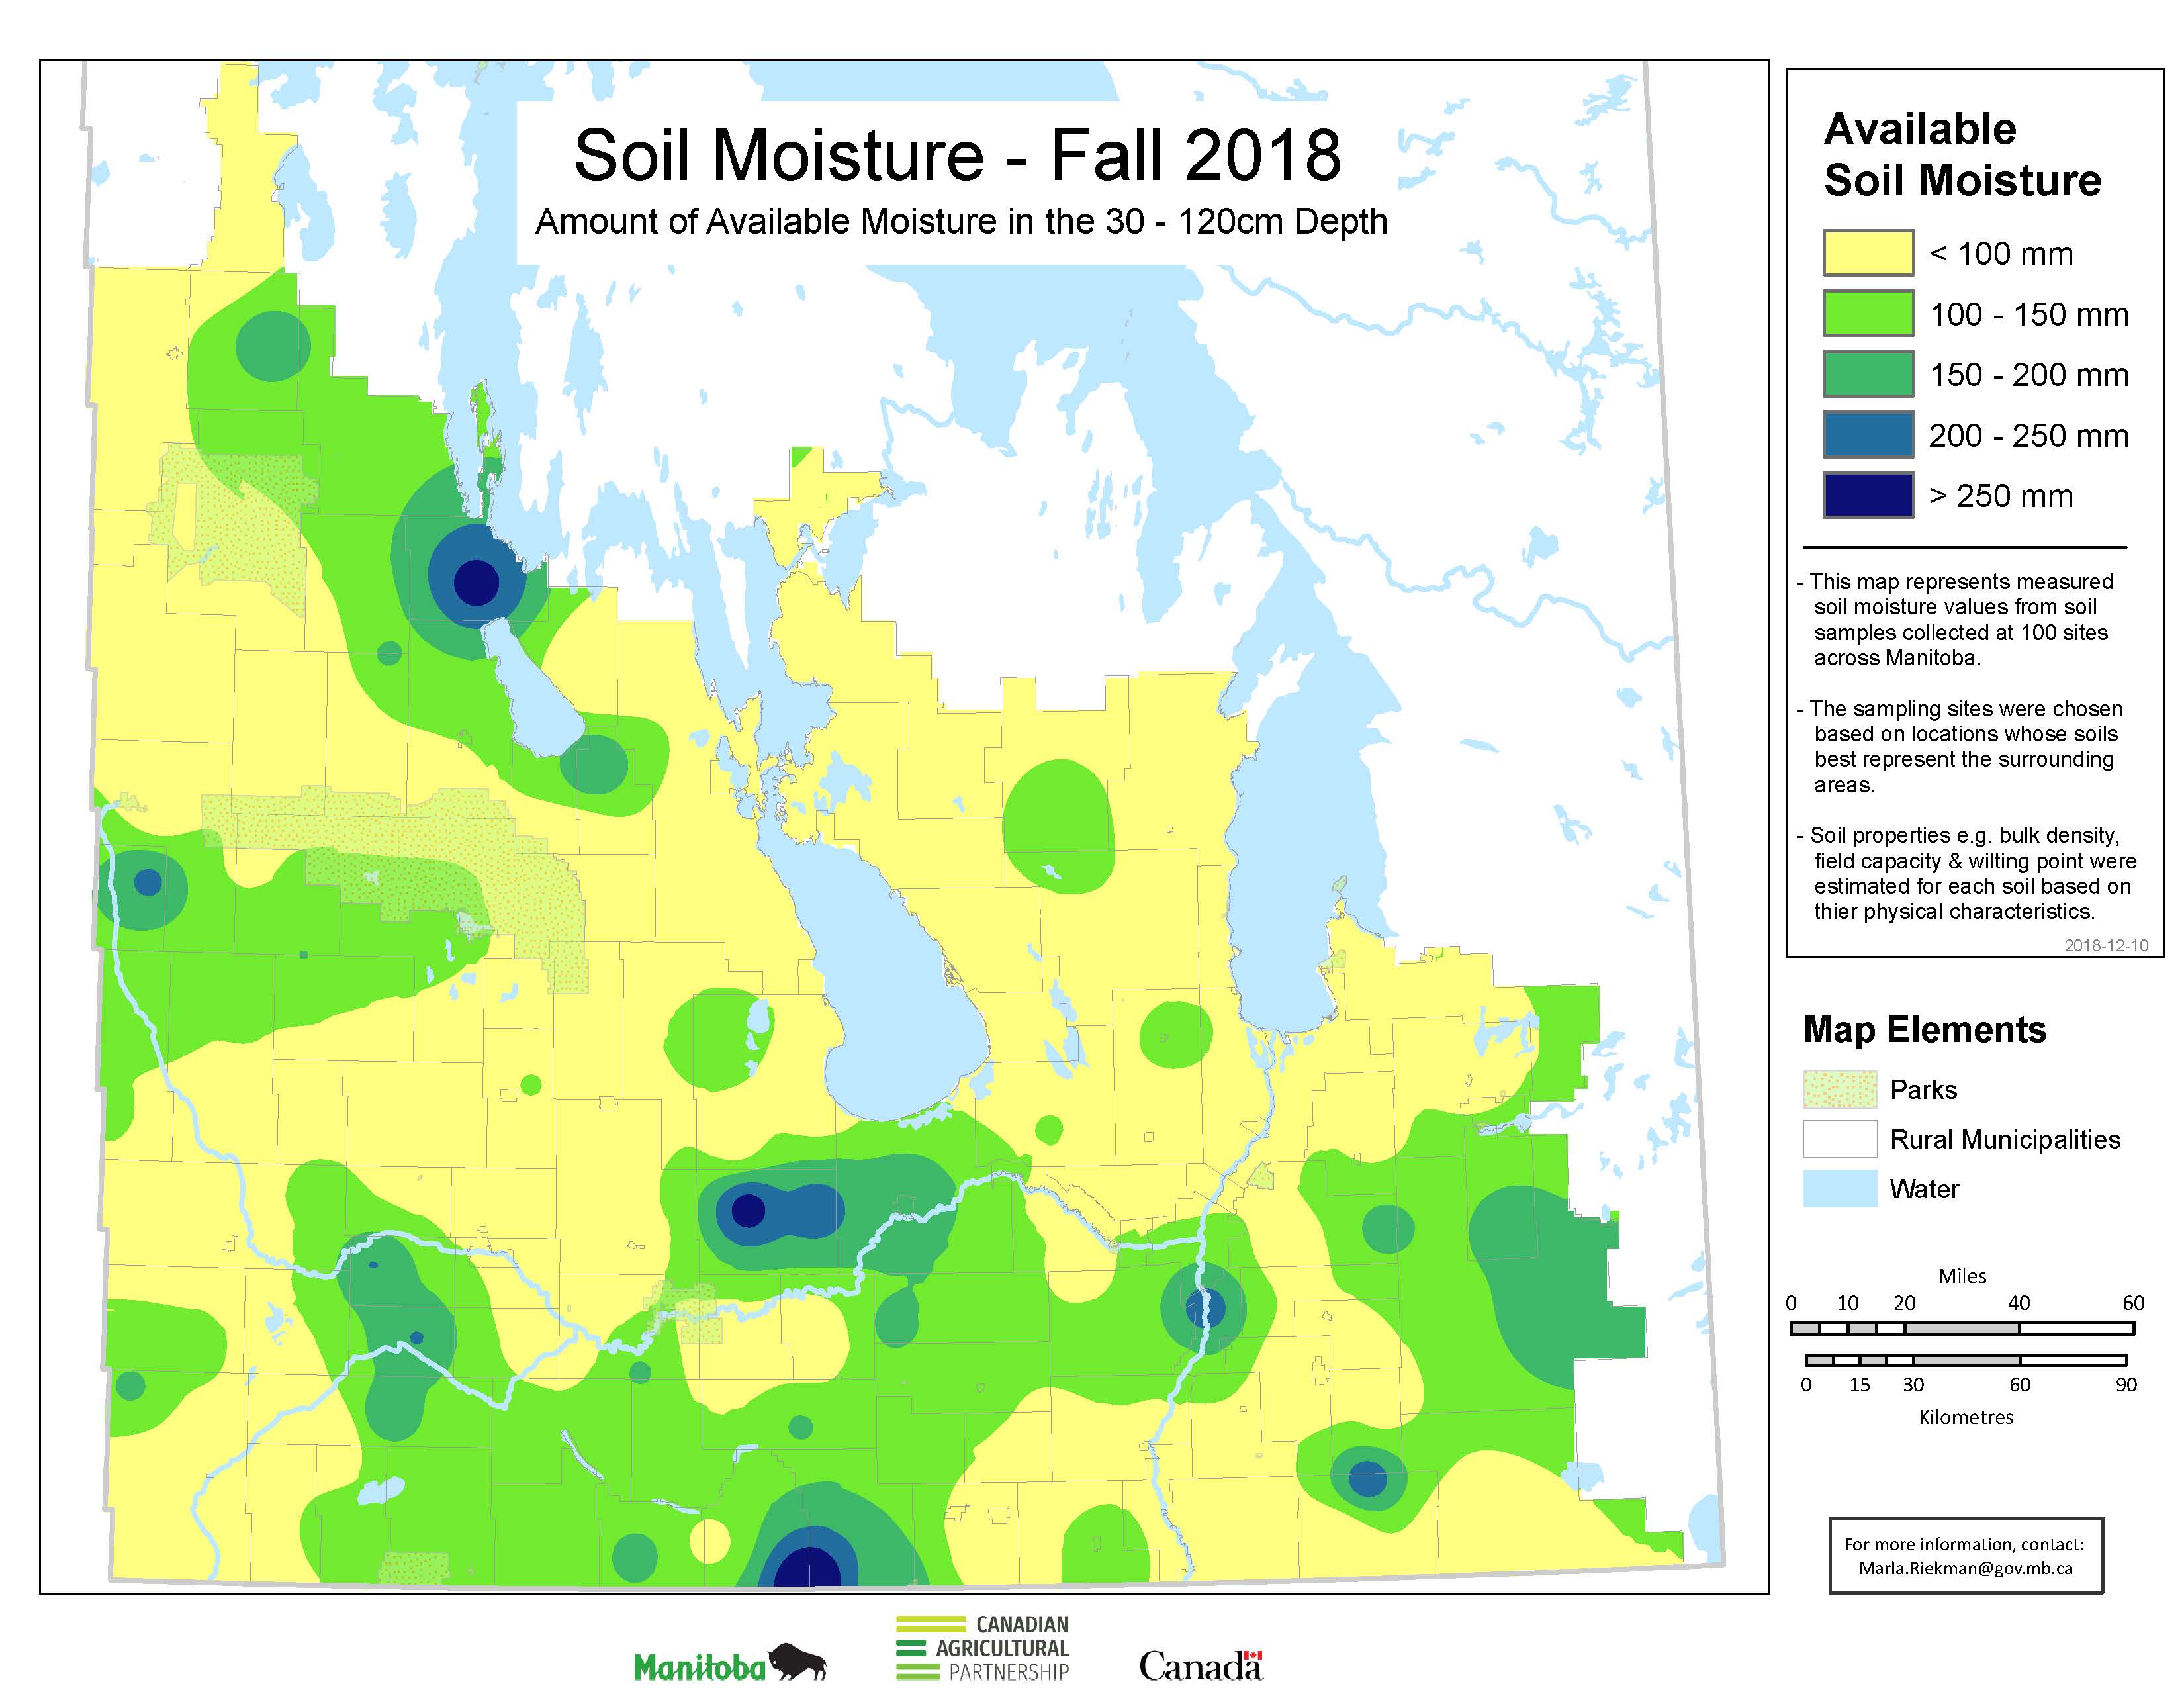
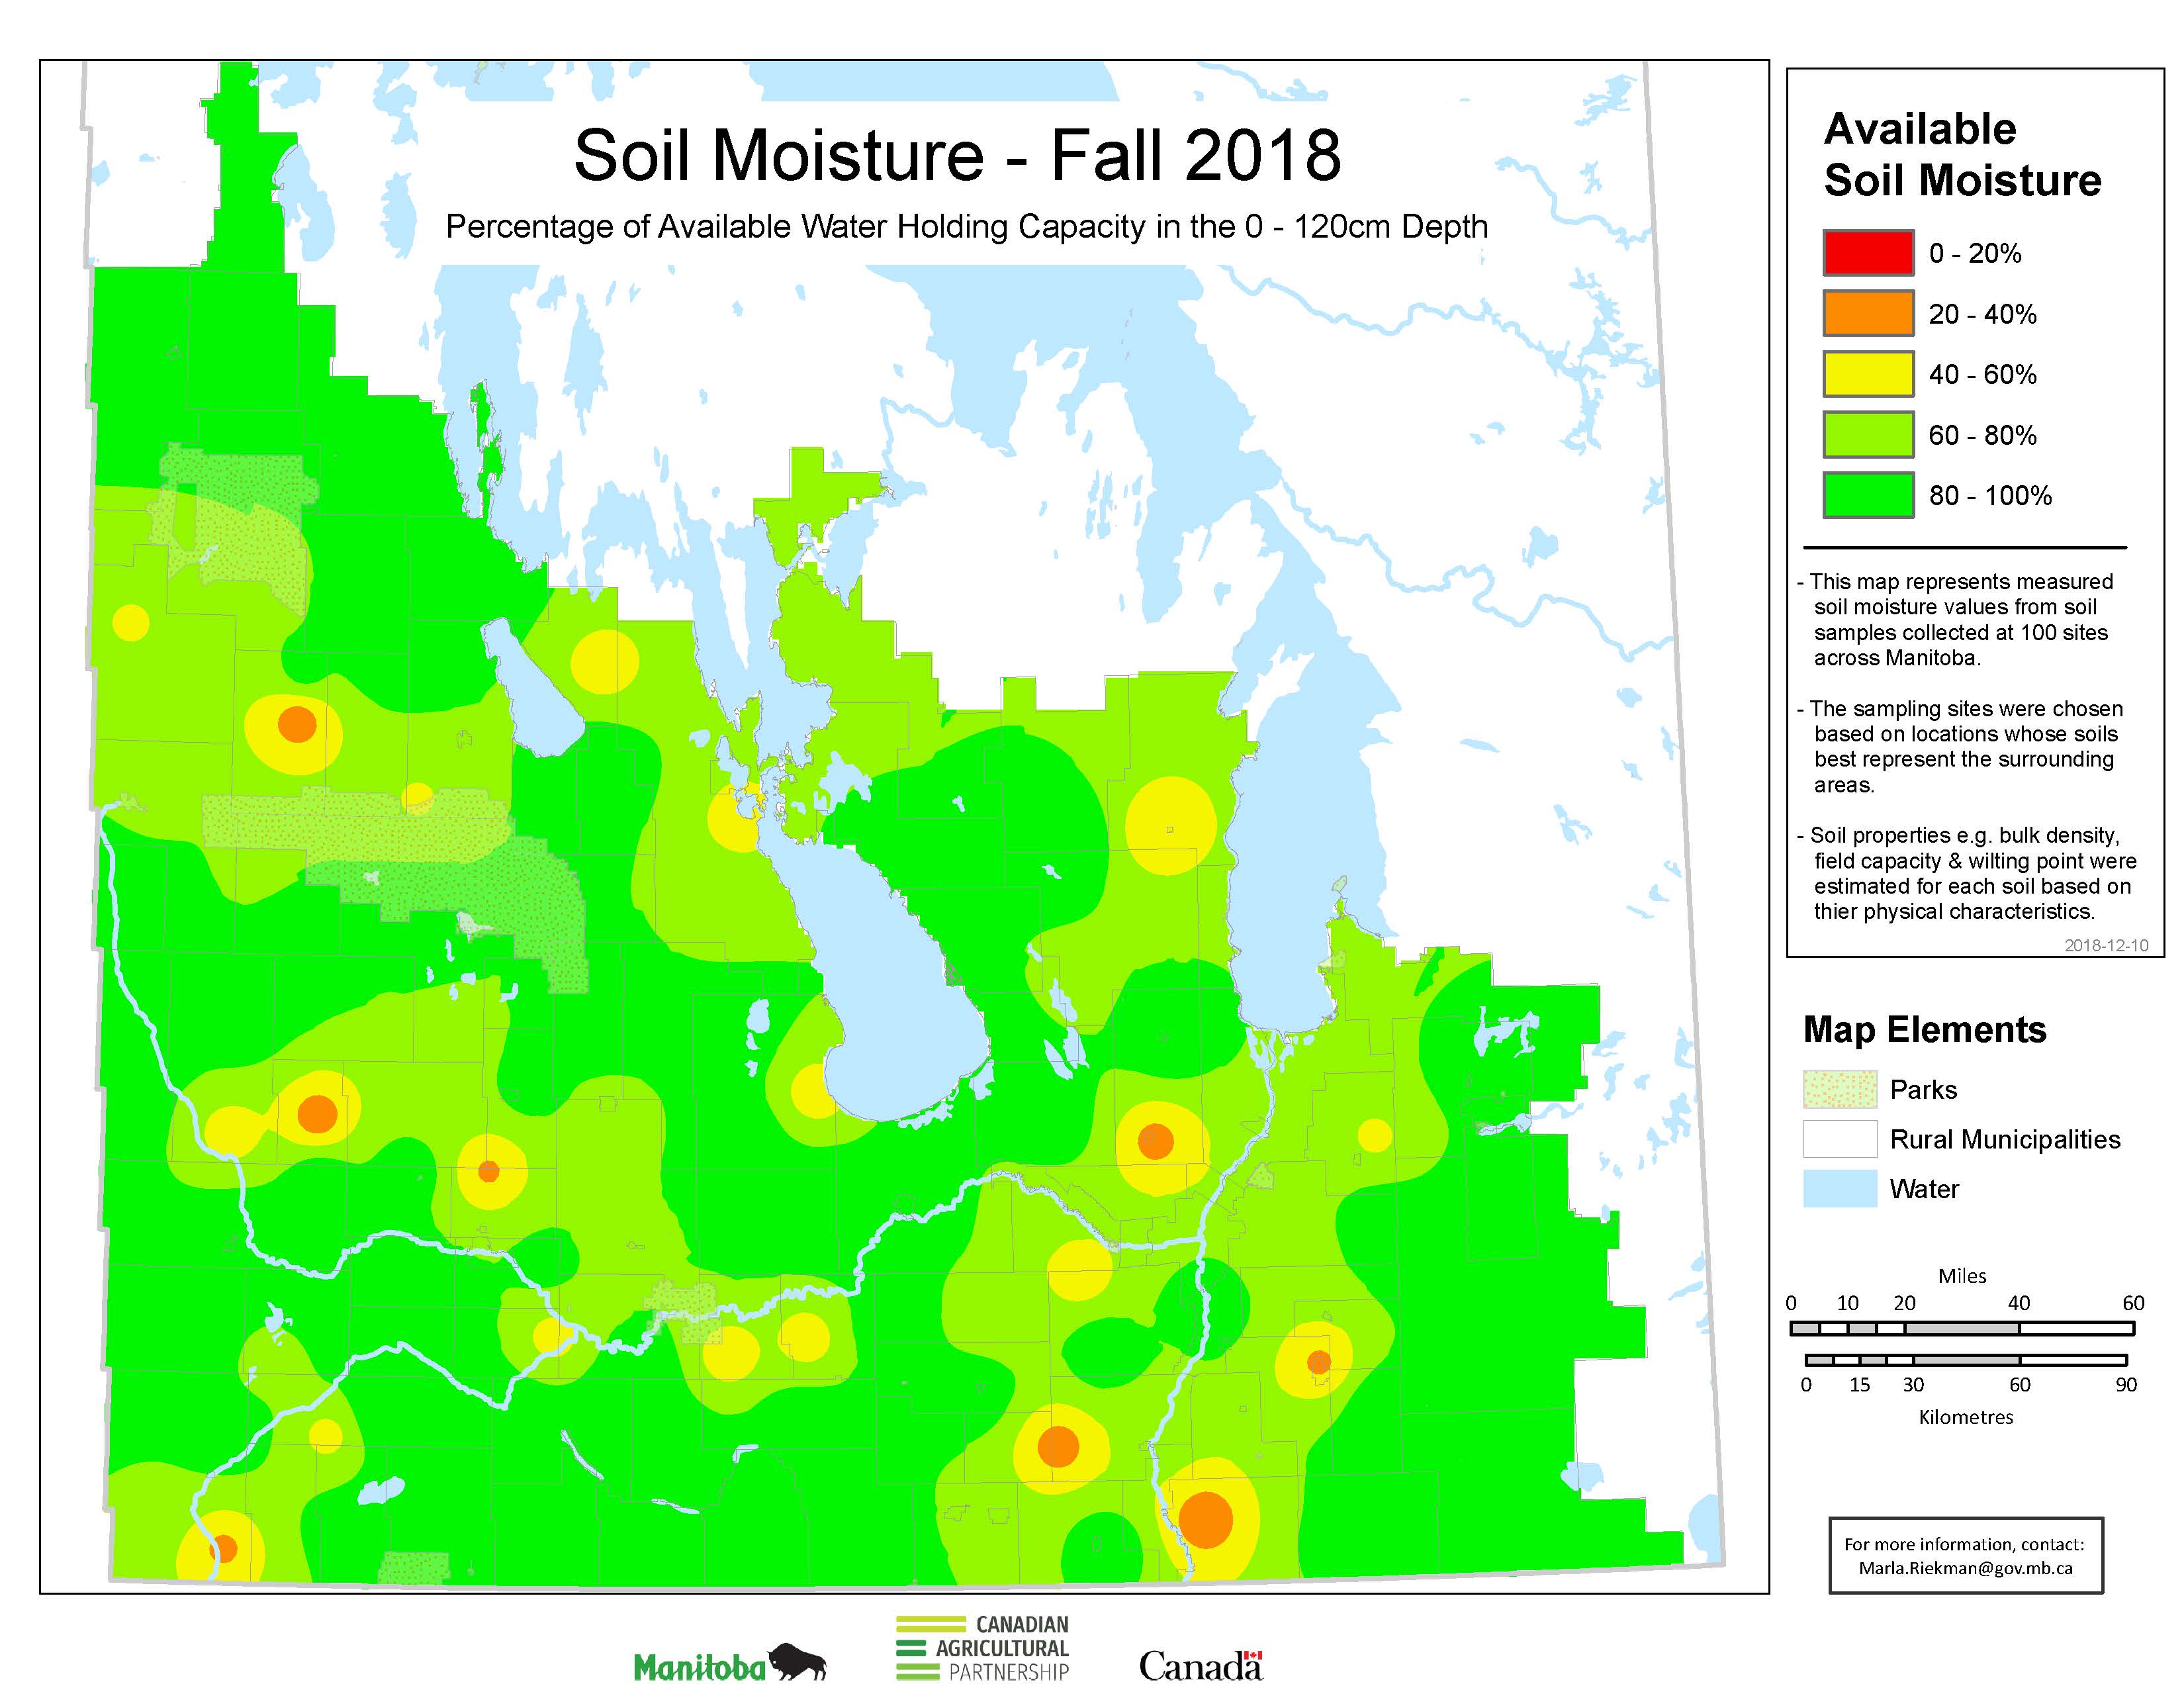
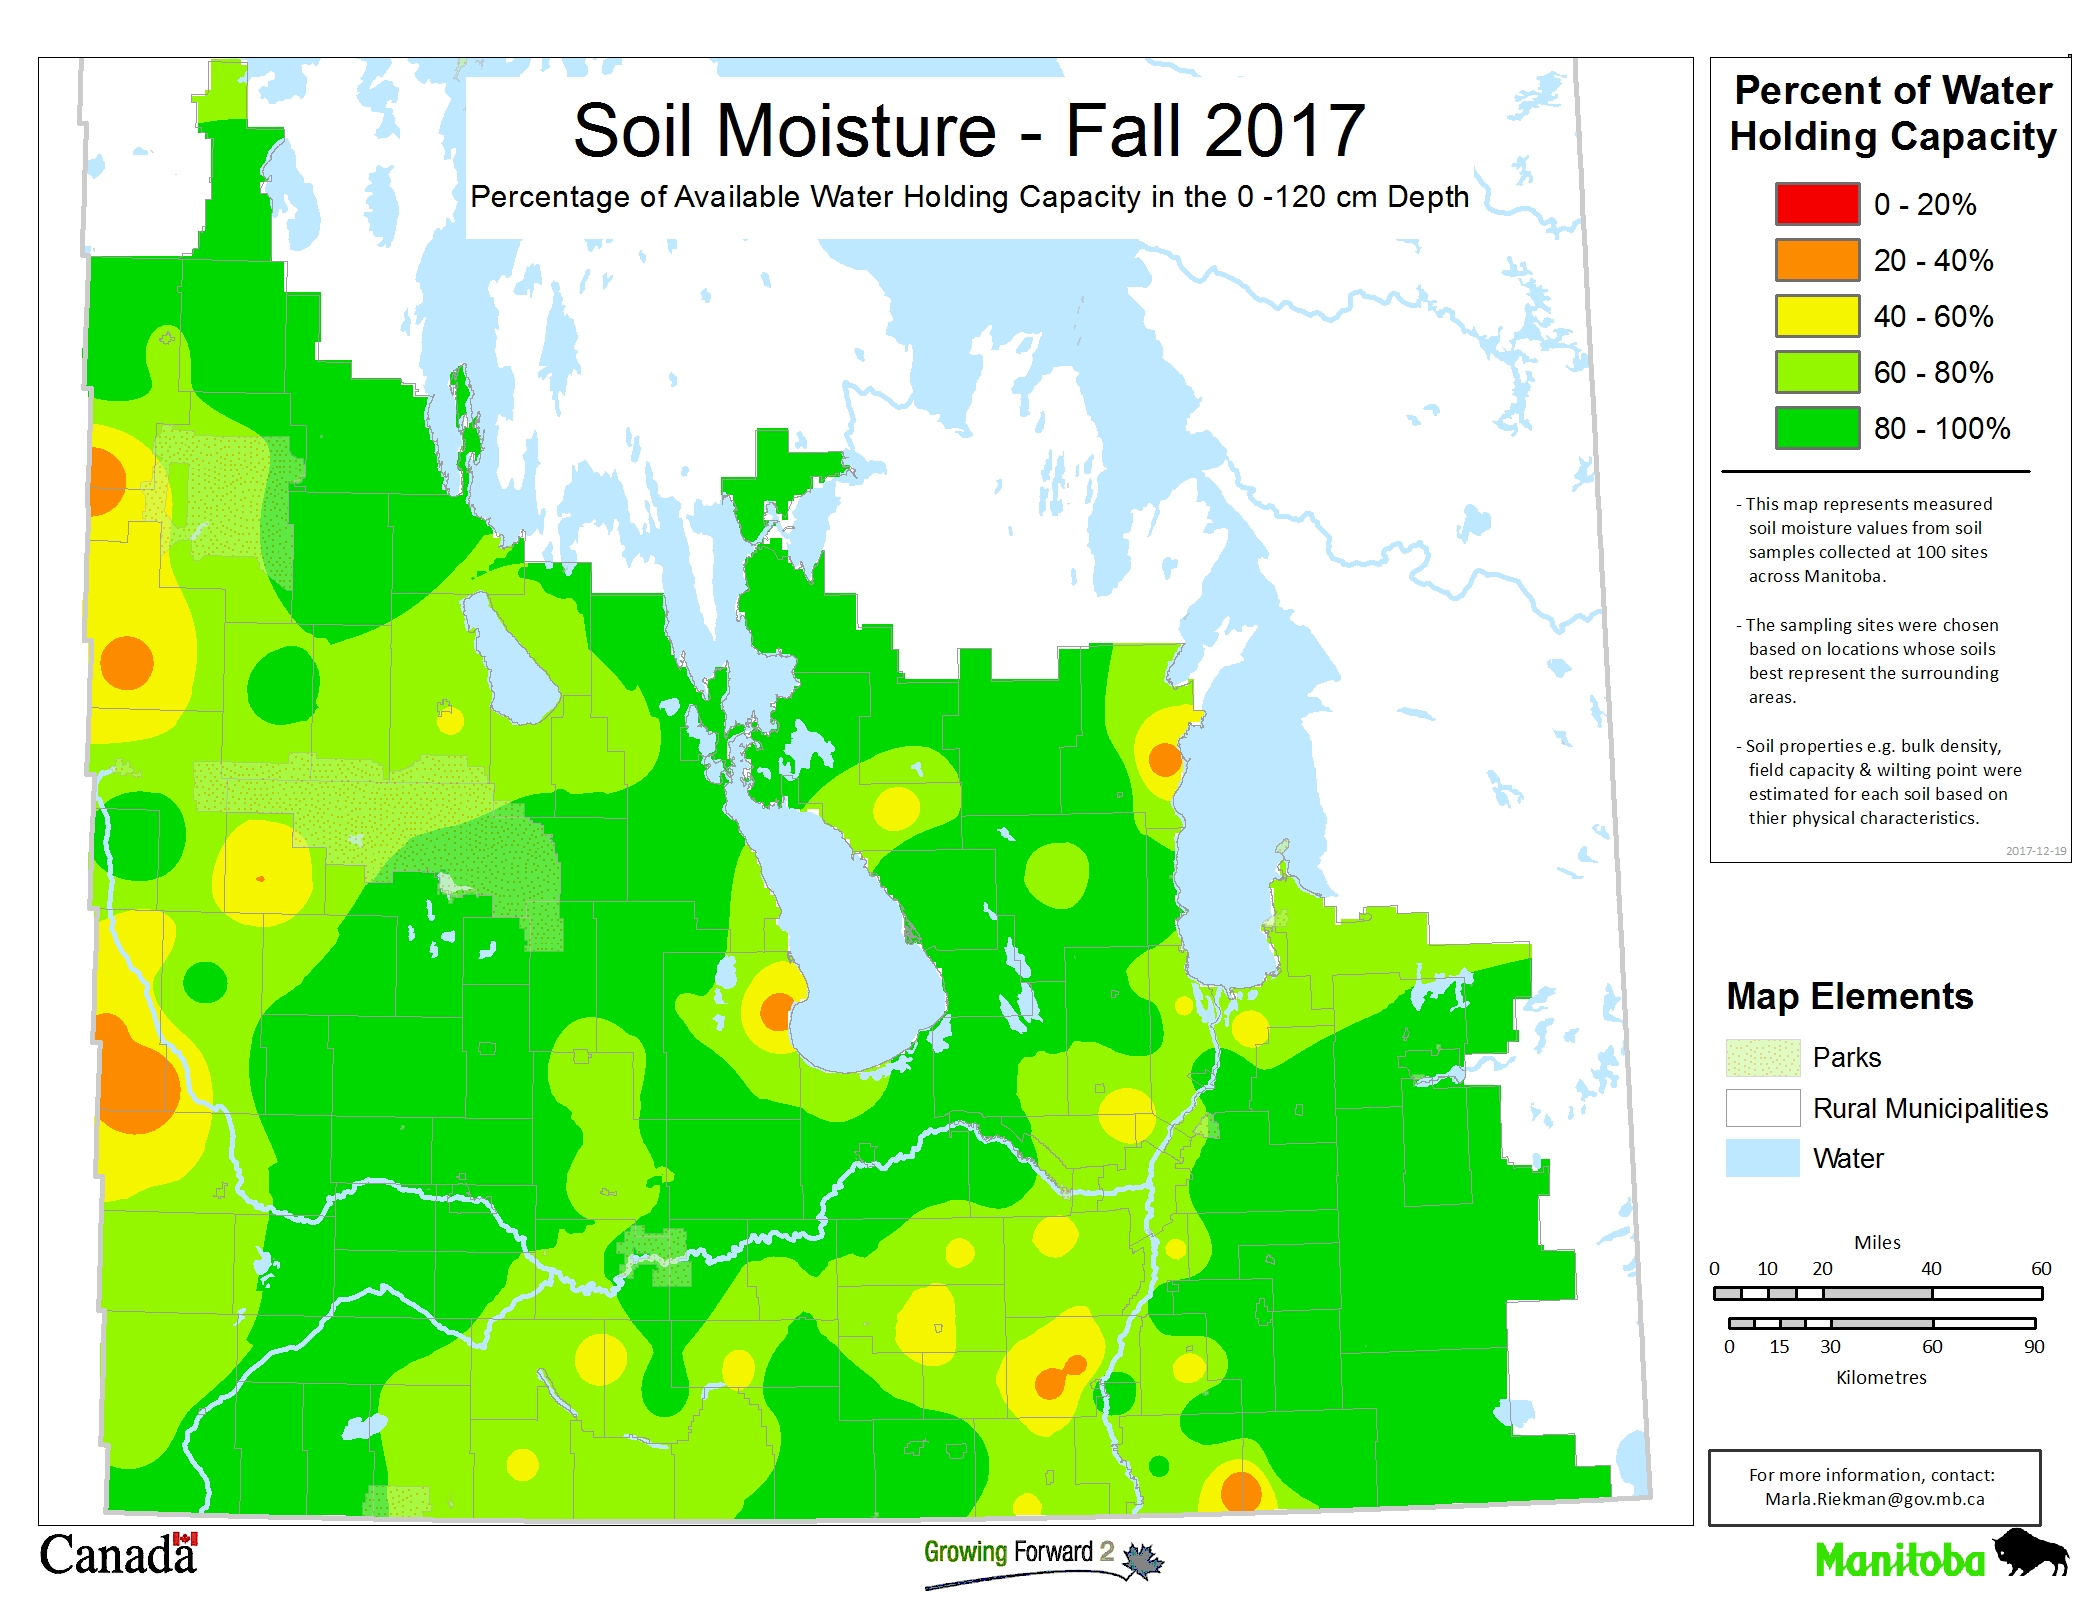
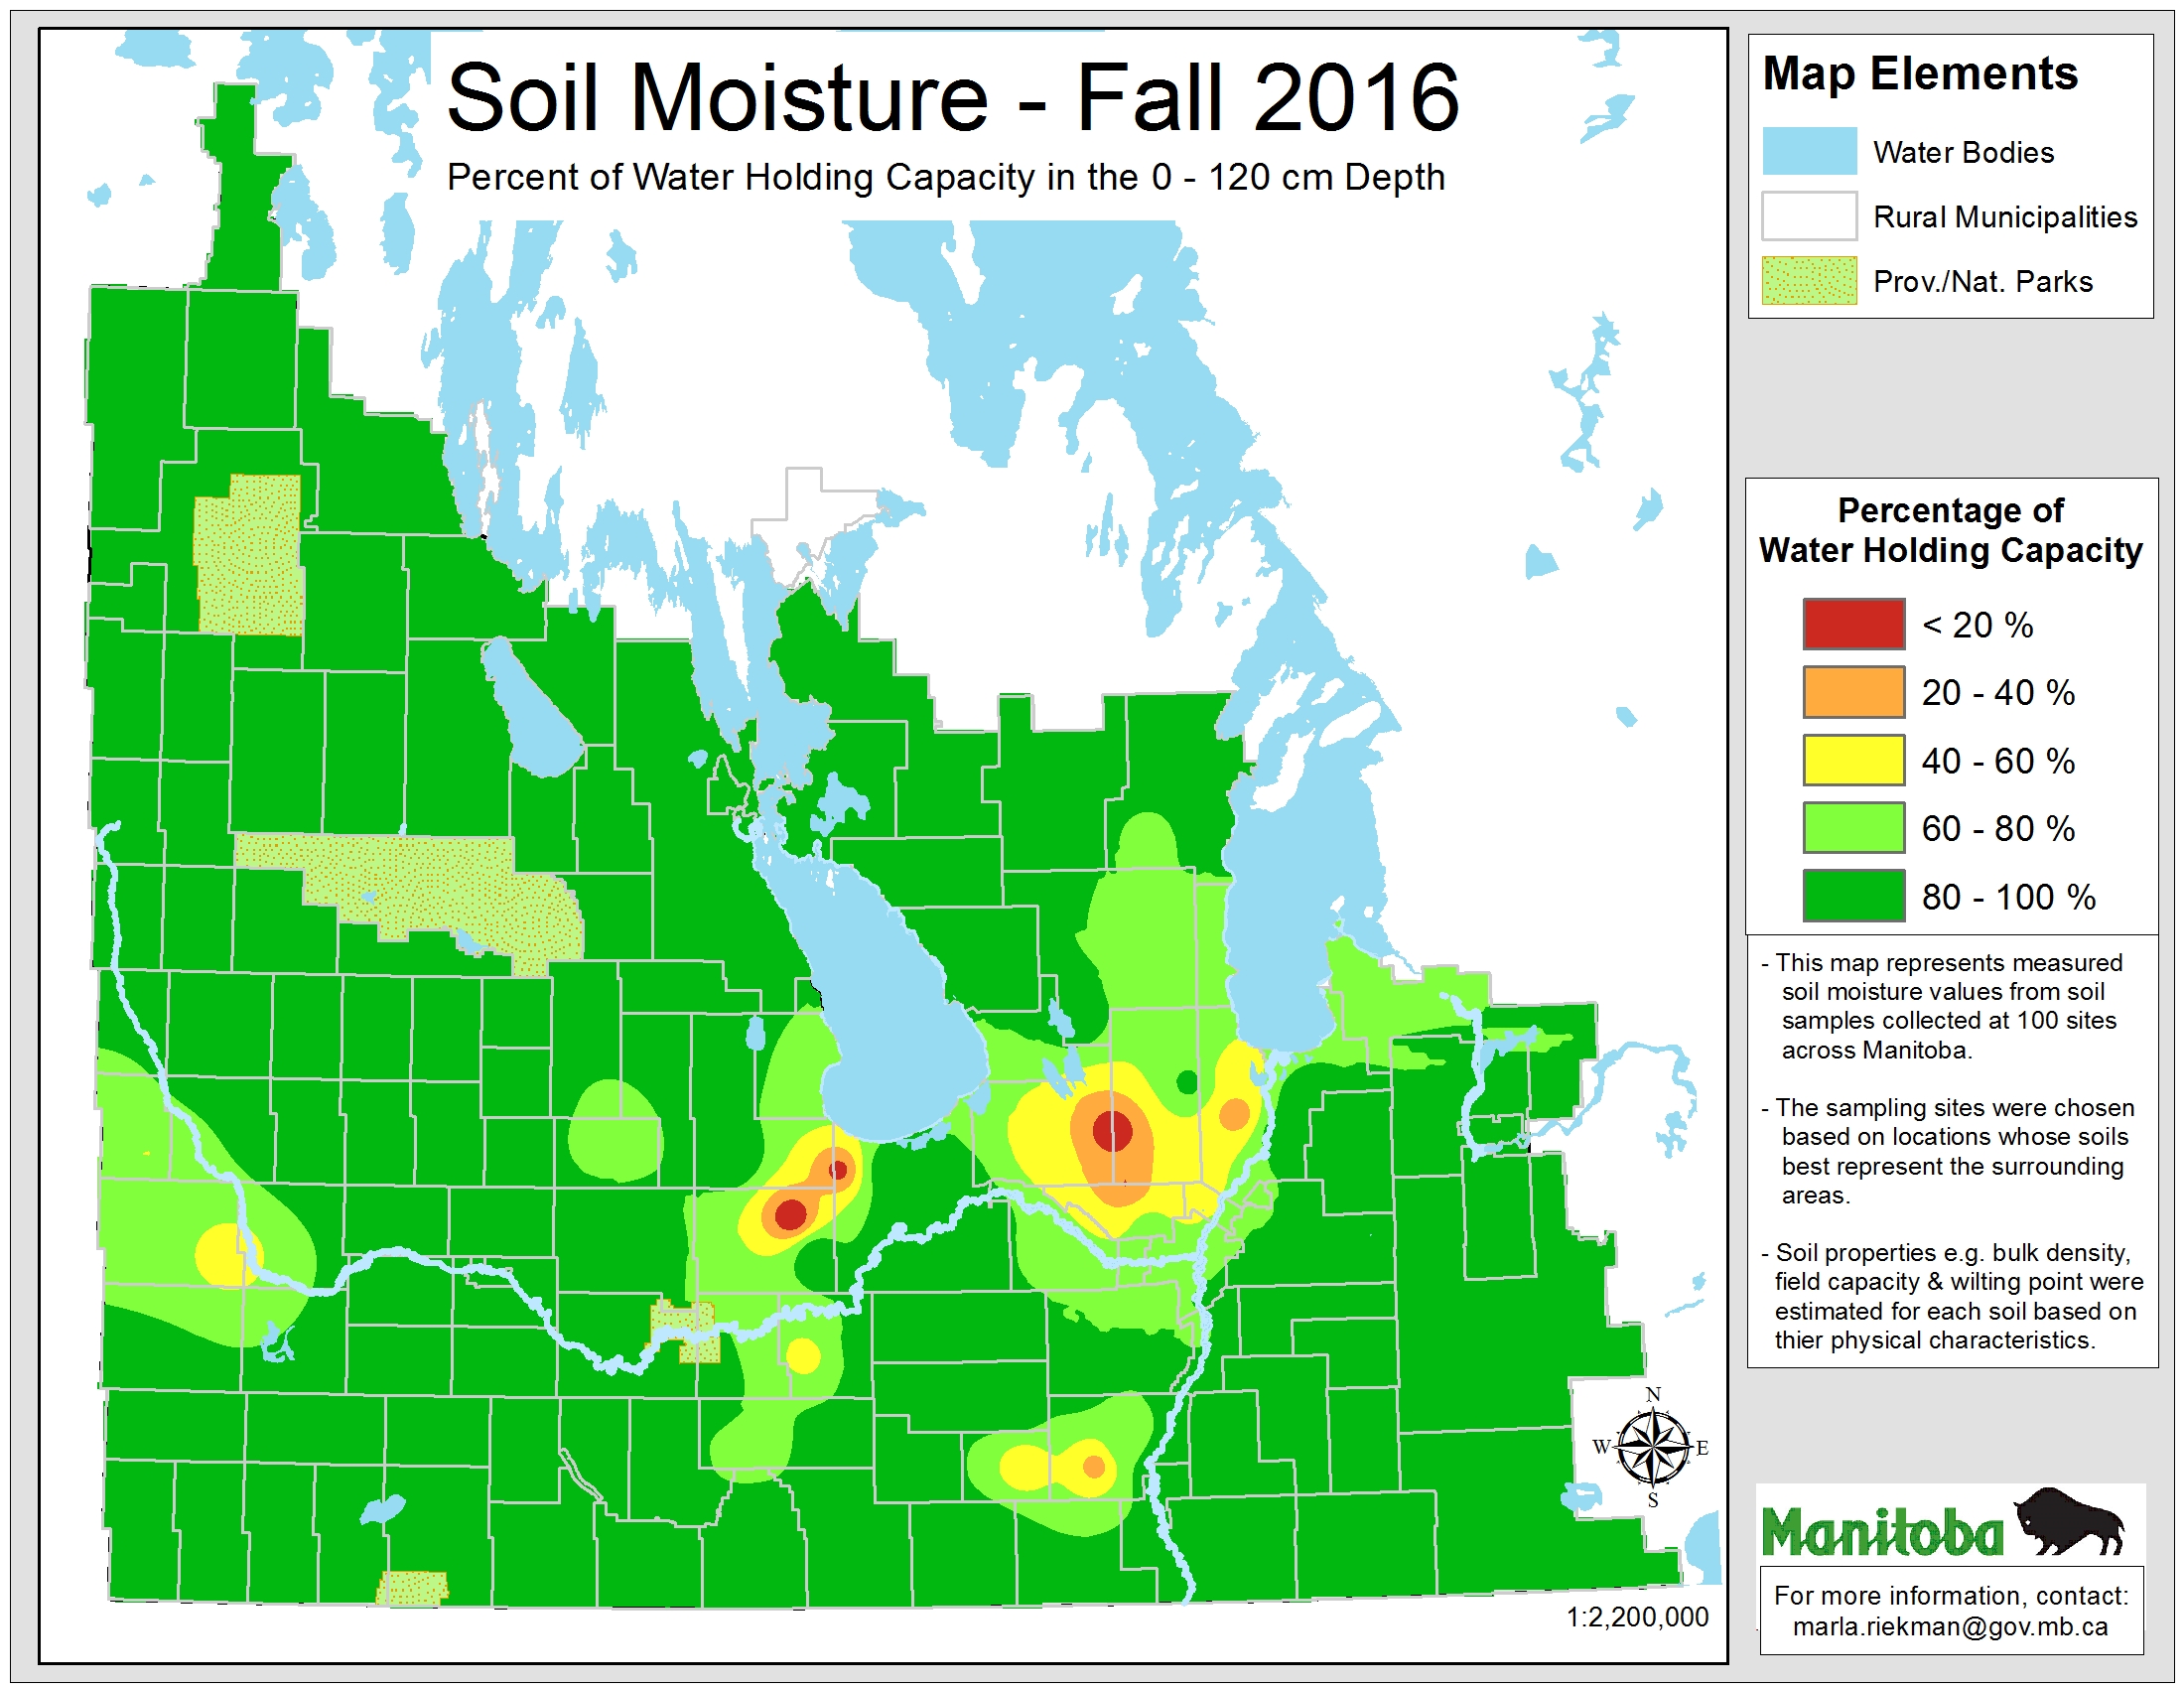
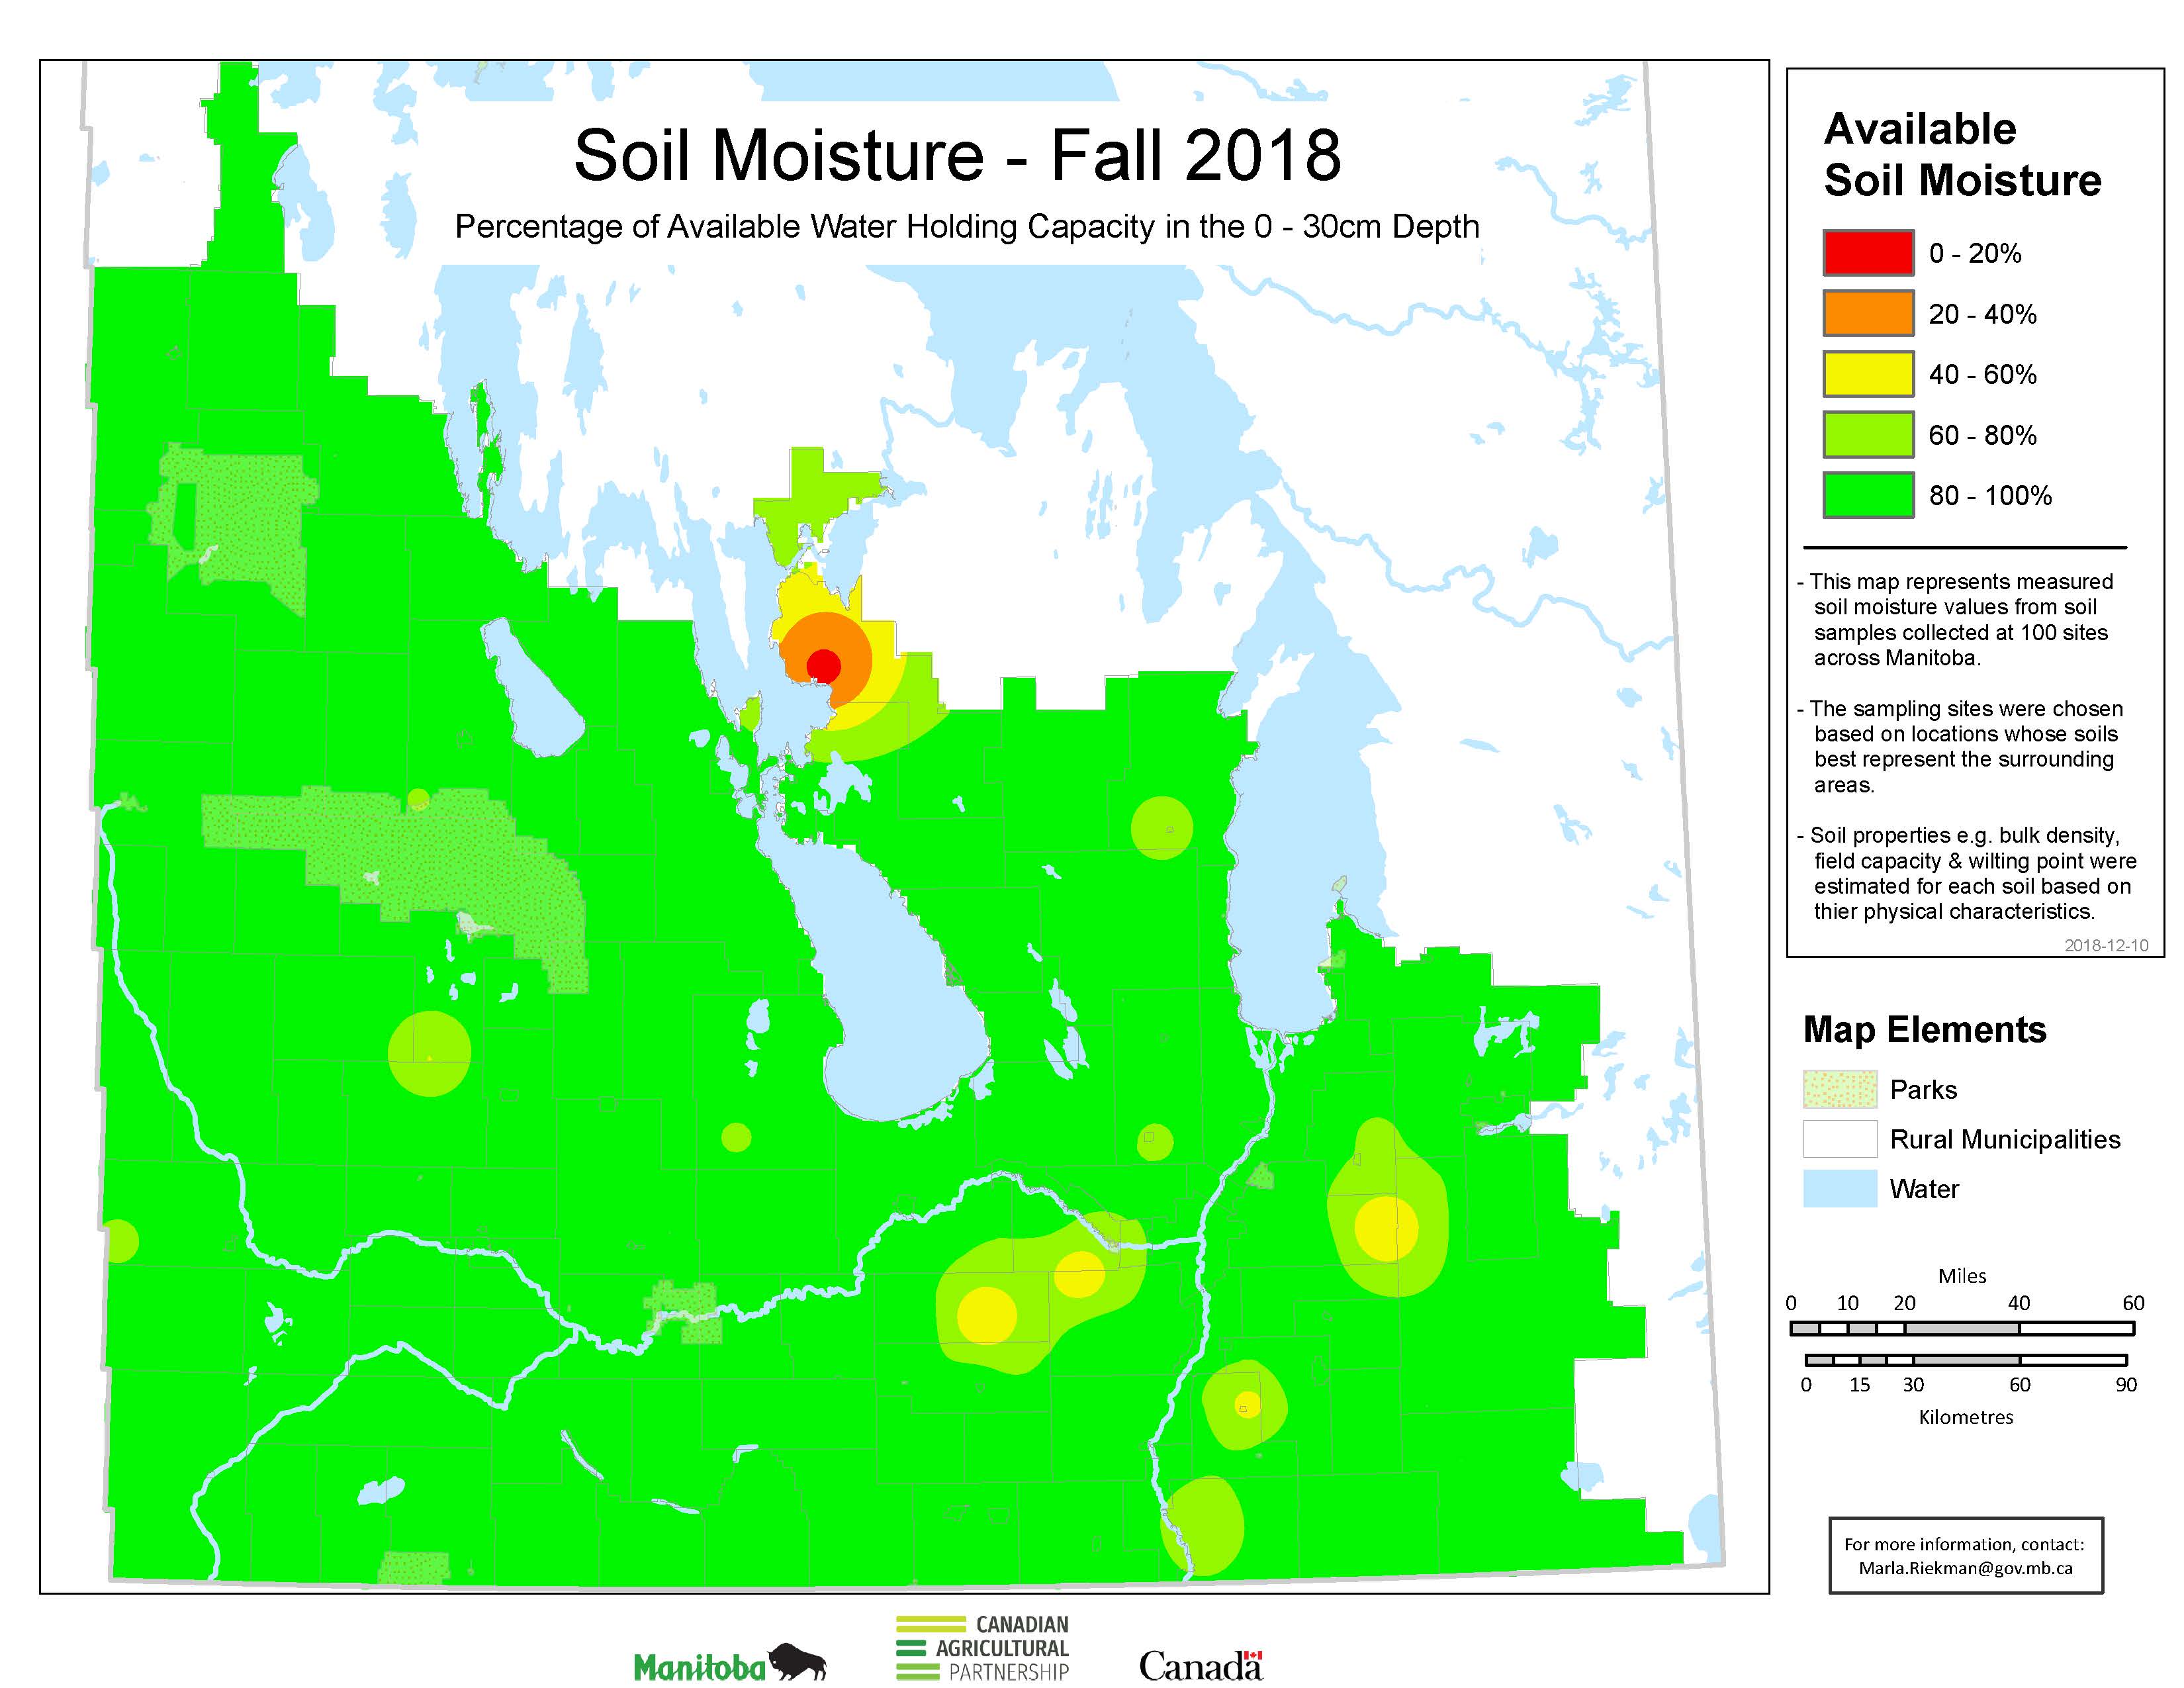
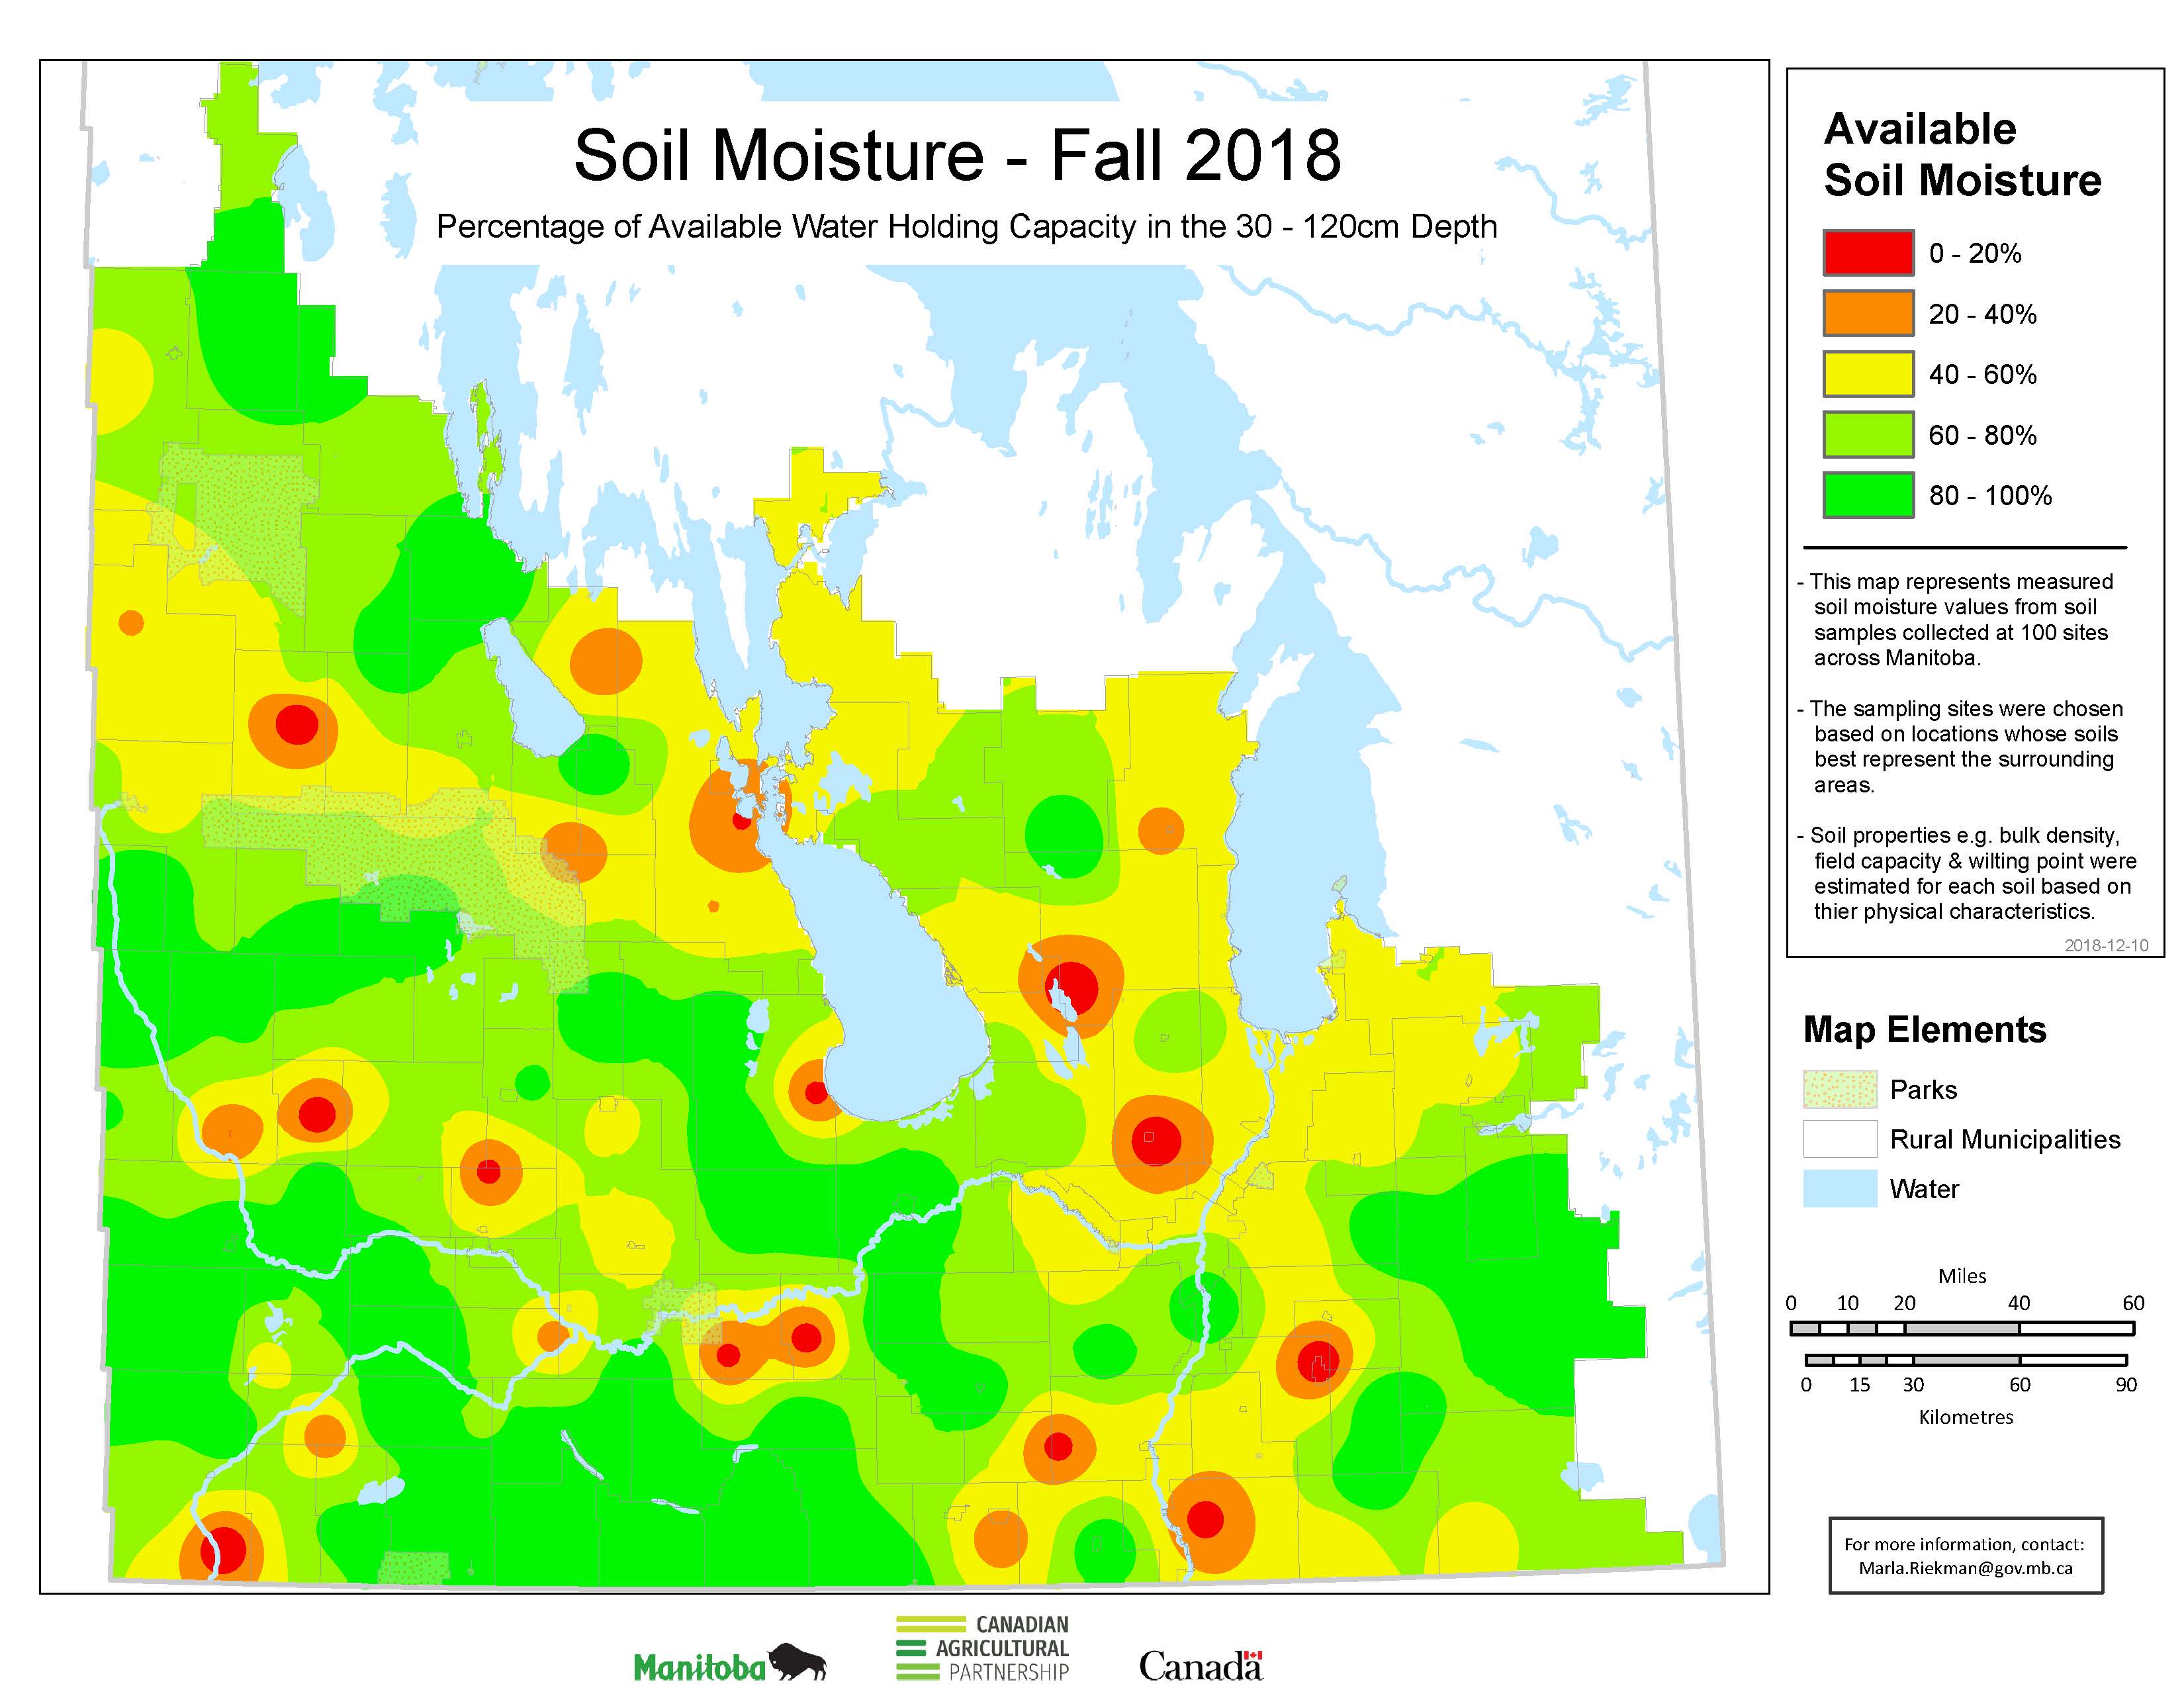
The amount of moisture within the root zone prior to freeze-up provides a good indication of what can be expected in the spring. With snow cover and freezing temperatures, soil moisture content remains relatively stable throughout the winter. This is especially true in frozen moist soils whose pores become "sealed off". For maps made prior to 2019, Manitoba Agriculture and Resource Development collected soil samples from about 100 sites across Agro-Manitoba during the last week of October and the first week of November.
Each sampling site was chosen based on the soil properties that best respresent each area and the most common cropping system in the region. Soil samples were taken with a soil auger at five depths throughout the root zone: 0-15 cm, 15-30 cm, 30-60 cm, and 90-120 cm. Samples were placed immediately in sealed containers and subsequently weighed, oven dried, and re-weighed to determine their gravimetric moisture content (mass of moisture in mass of dry soil).
Each soil sample was classified based on its similarities to well-characterized soils around Manitoba. This enabled us to assign a bulk density, wilting point, field capacity, and available water holding capacity value (plant available water) to each depth from each sampling site. From there, soil moisture by weight was converted to percent soil moisture by volume. The available water and soil moisture as a percent of available water holding capacity were calculated and are shown on the maps.
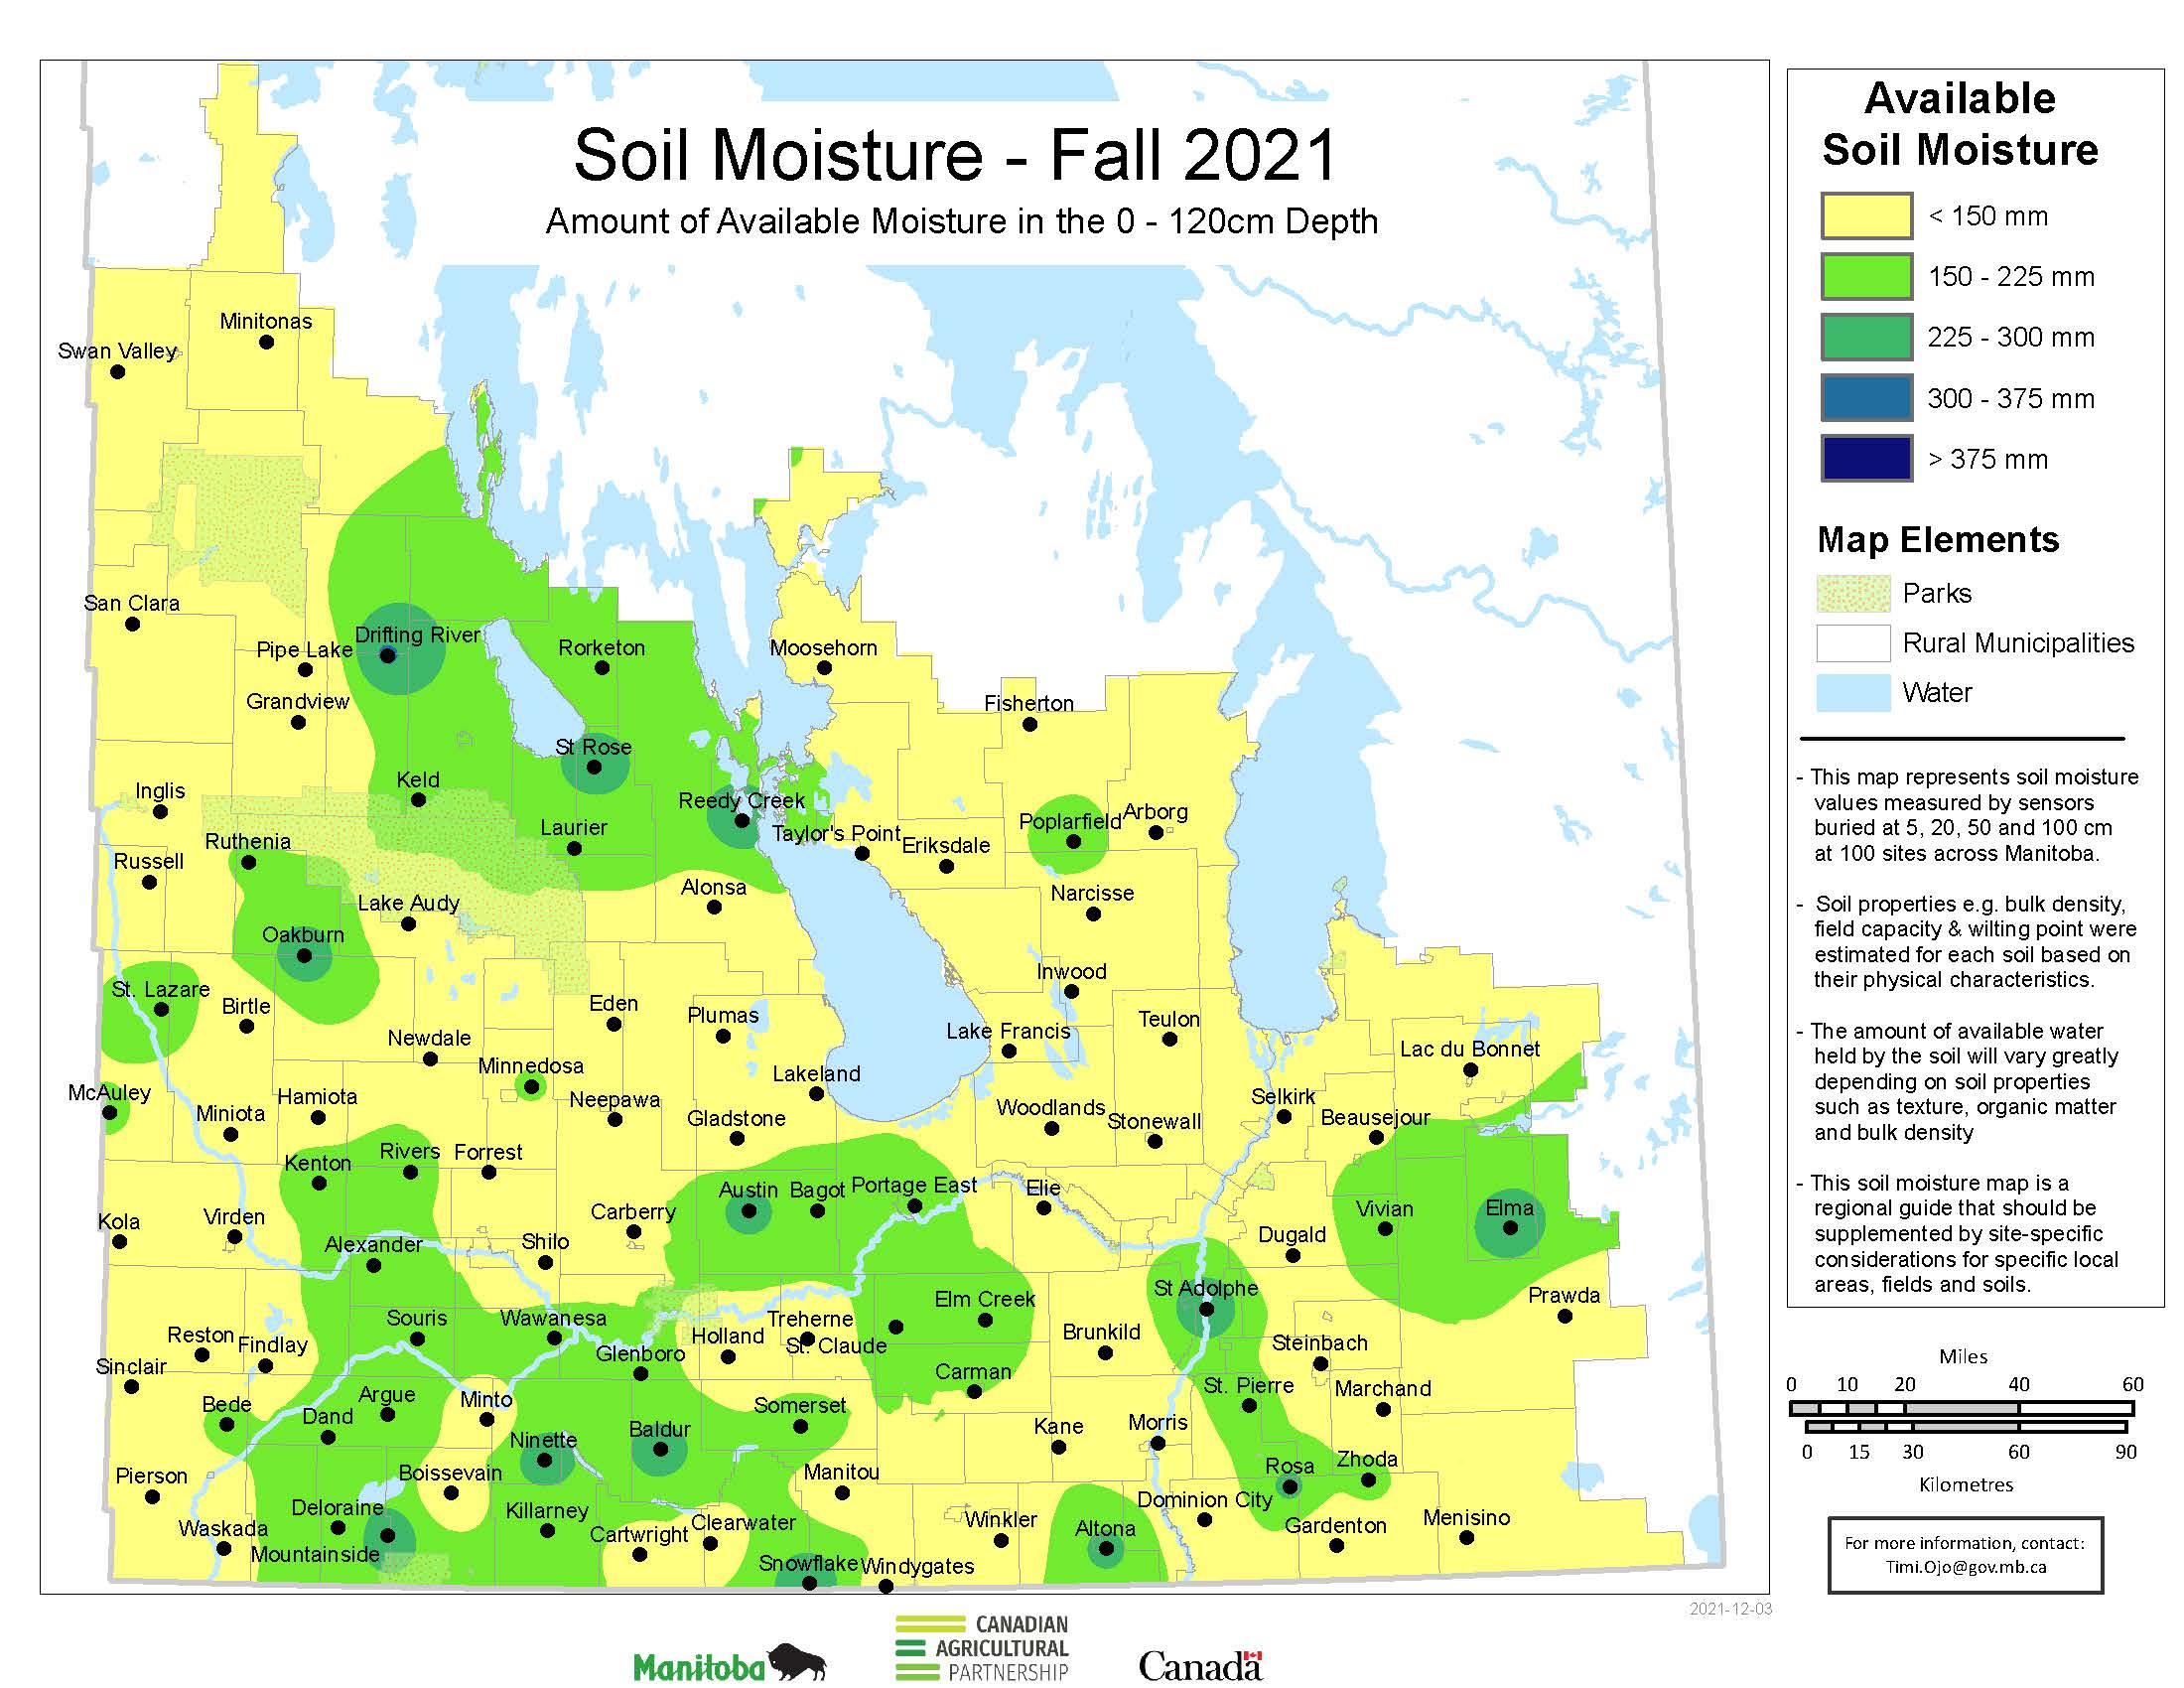
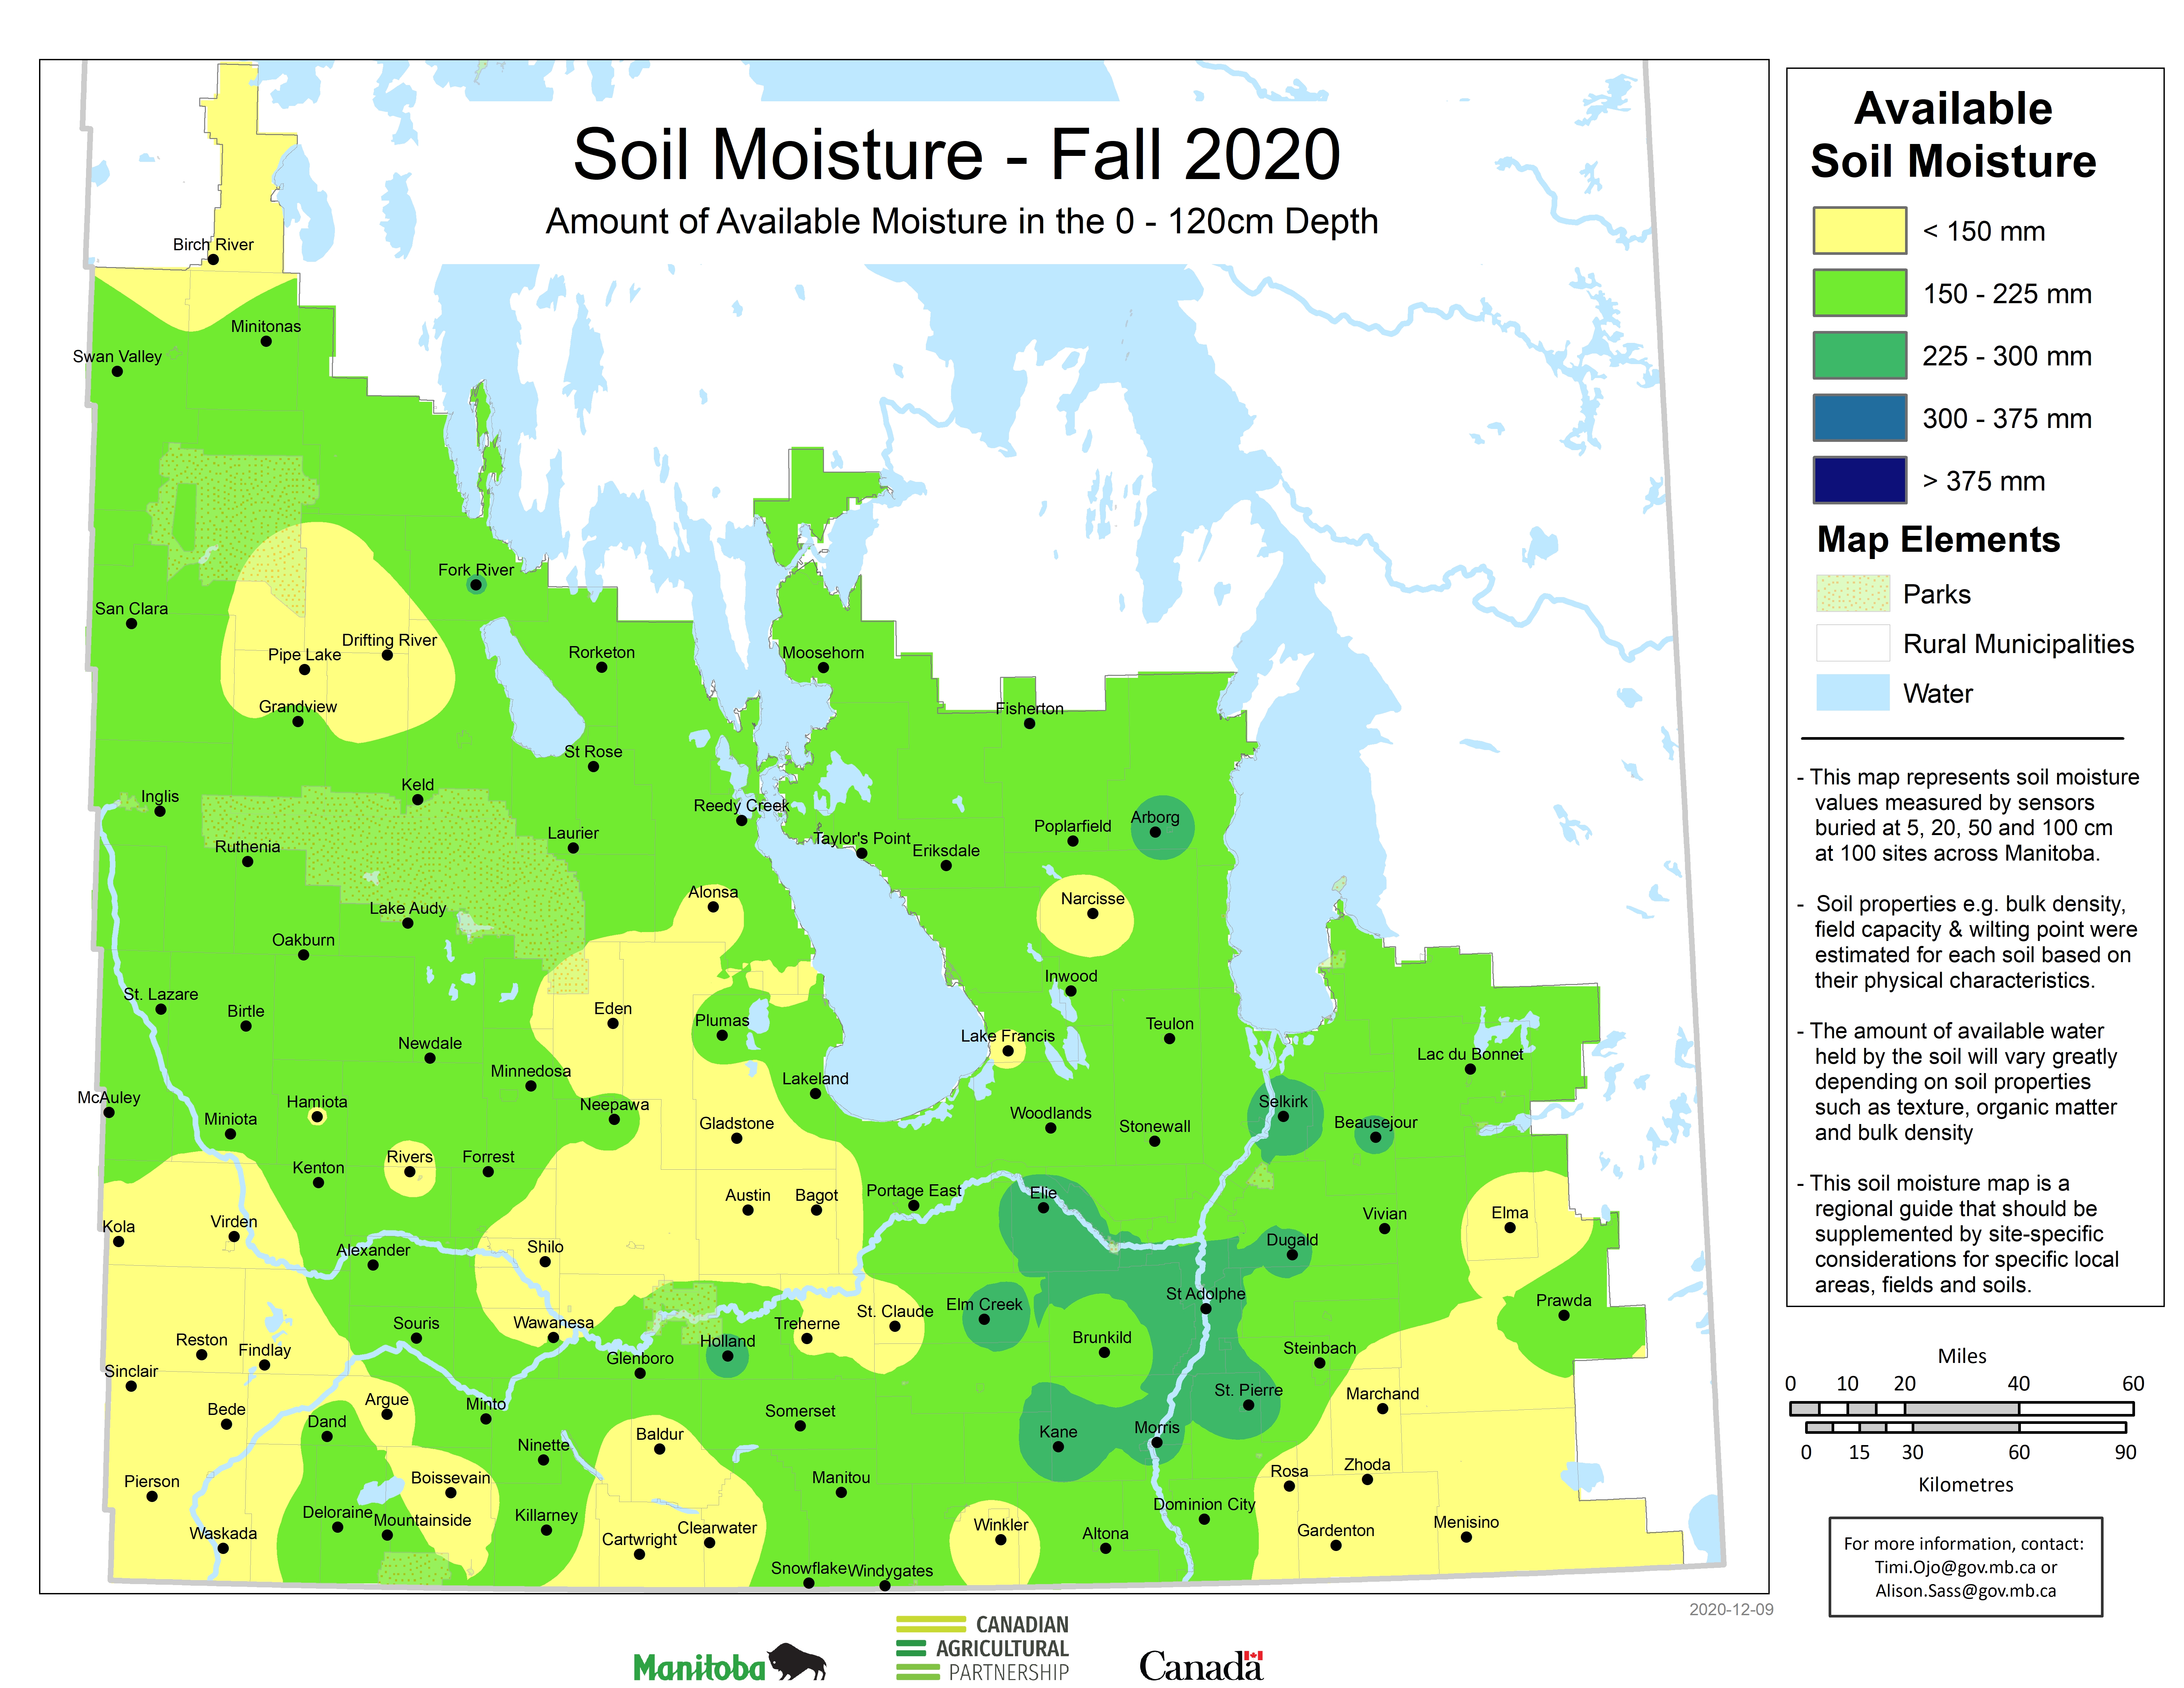
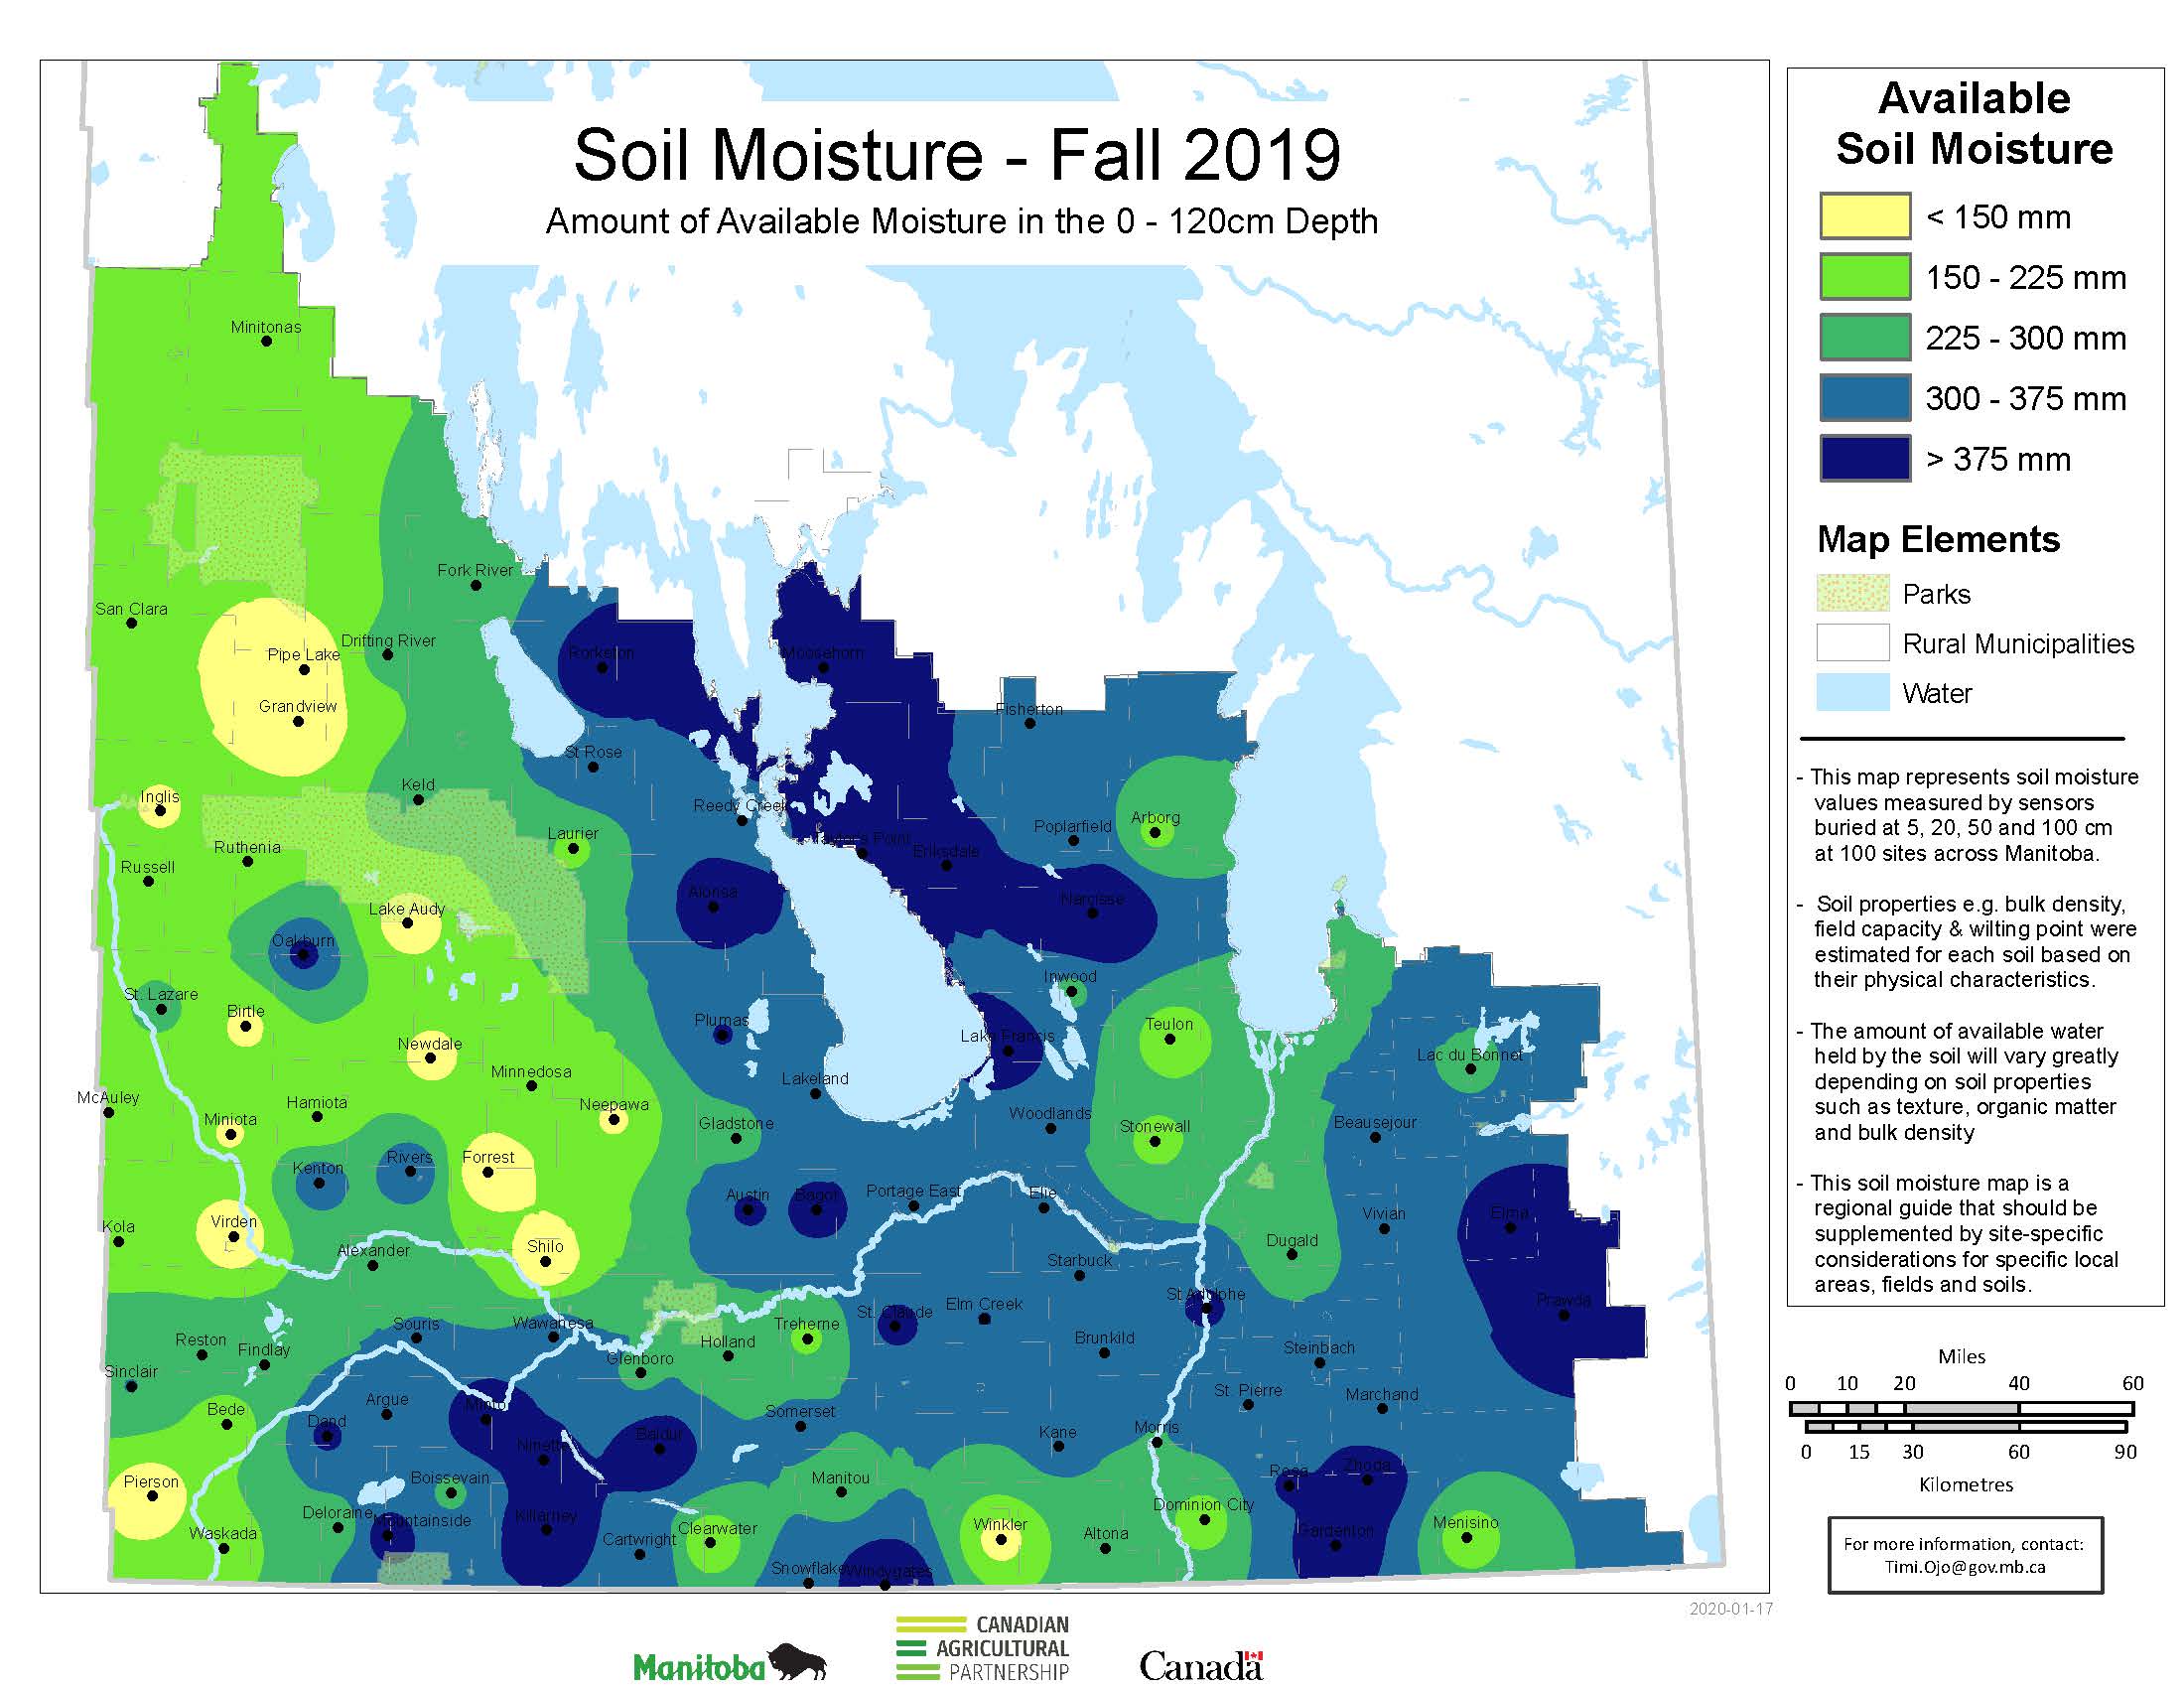
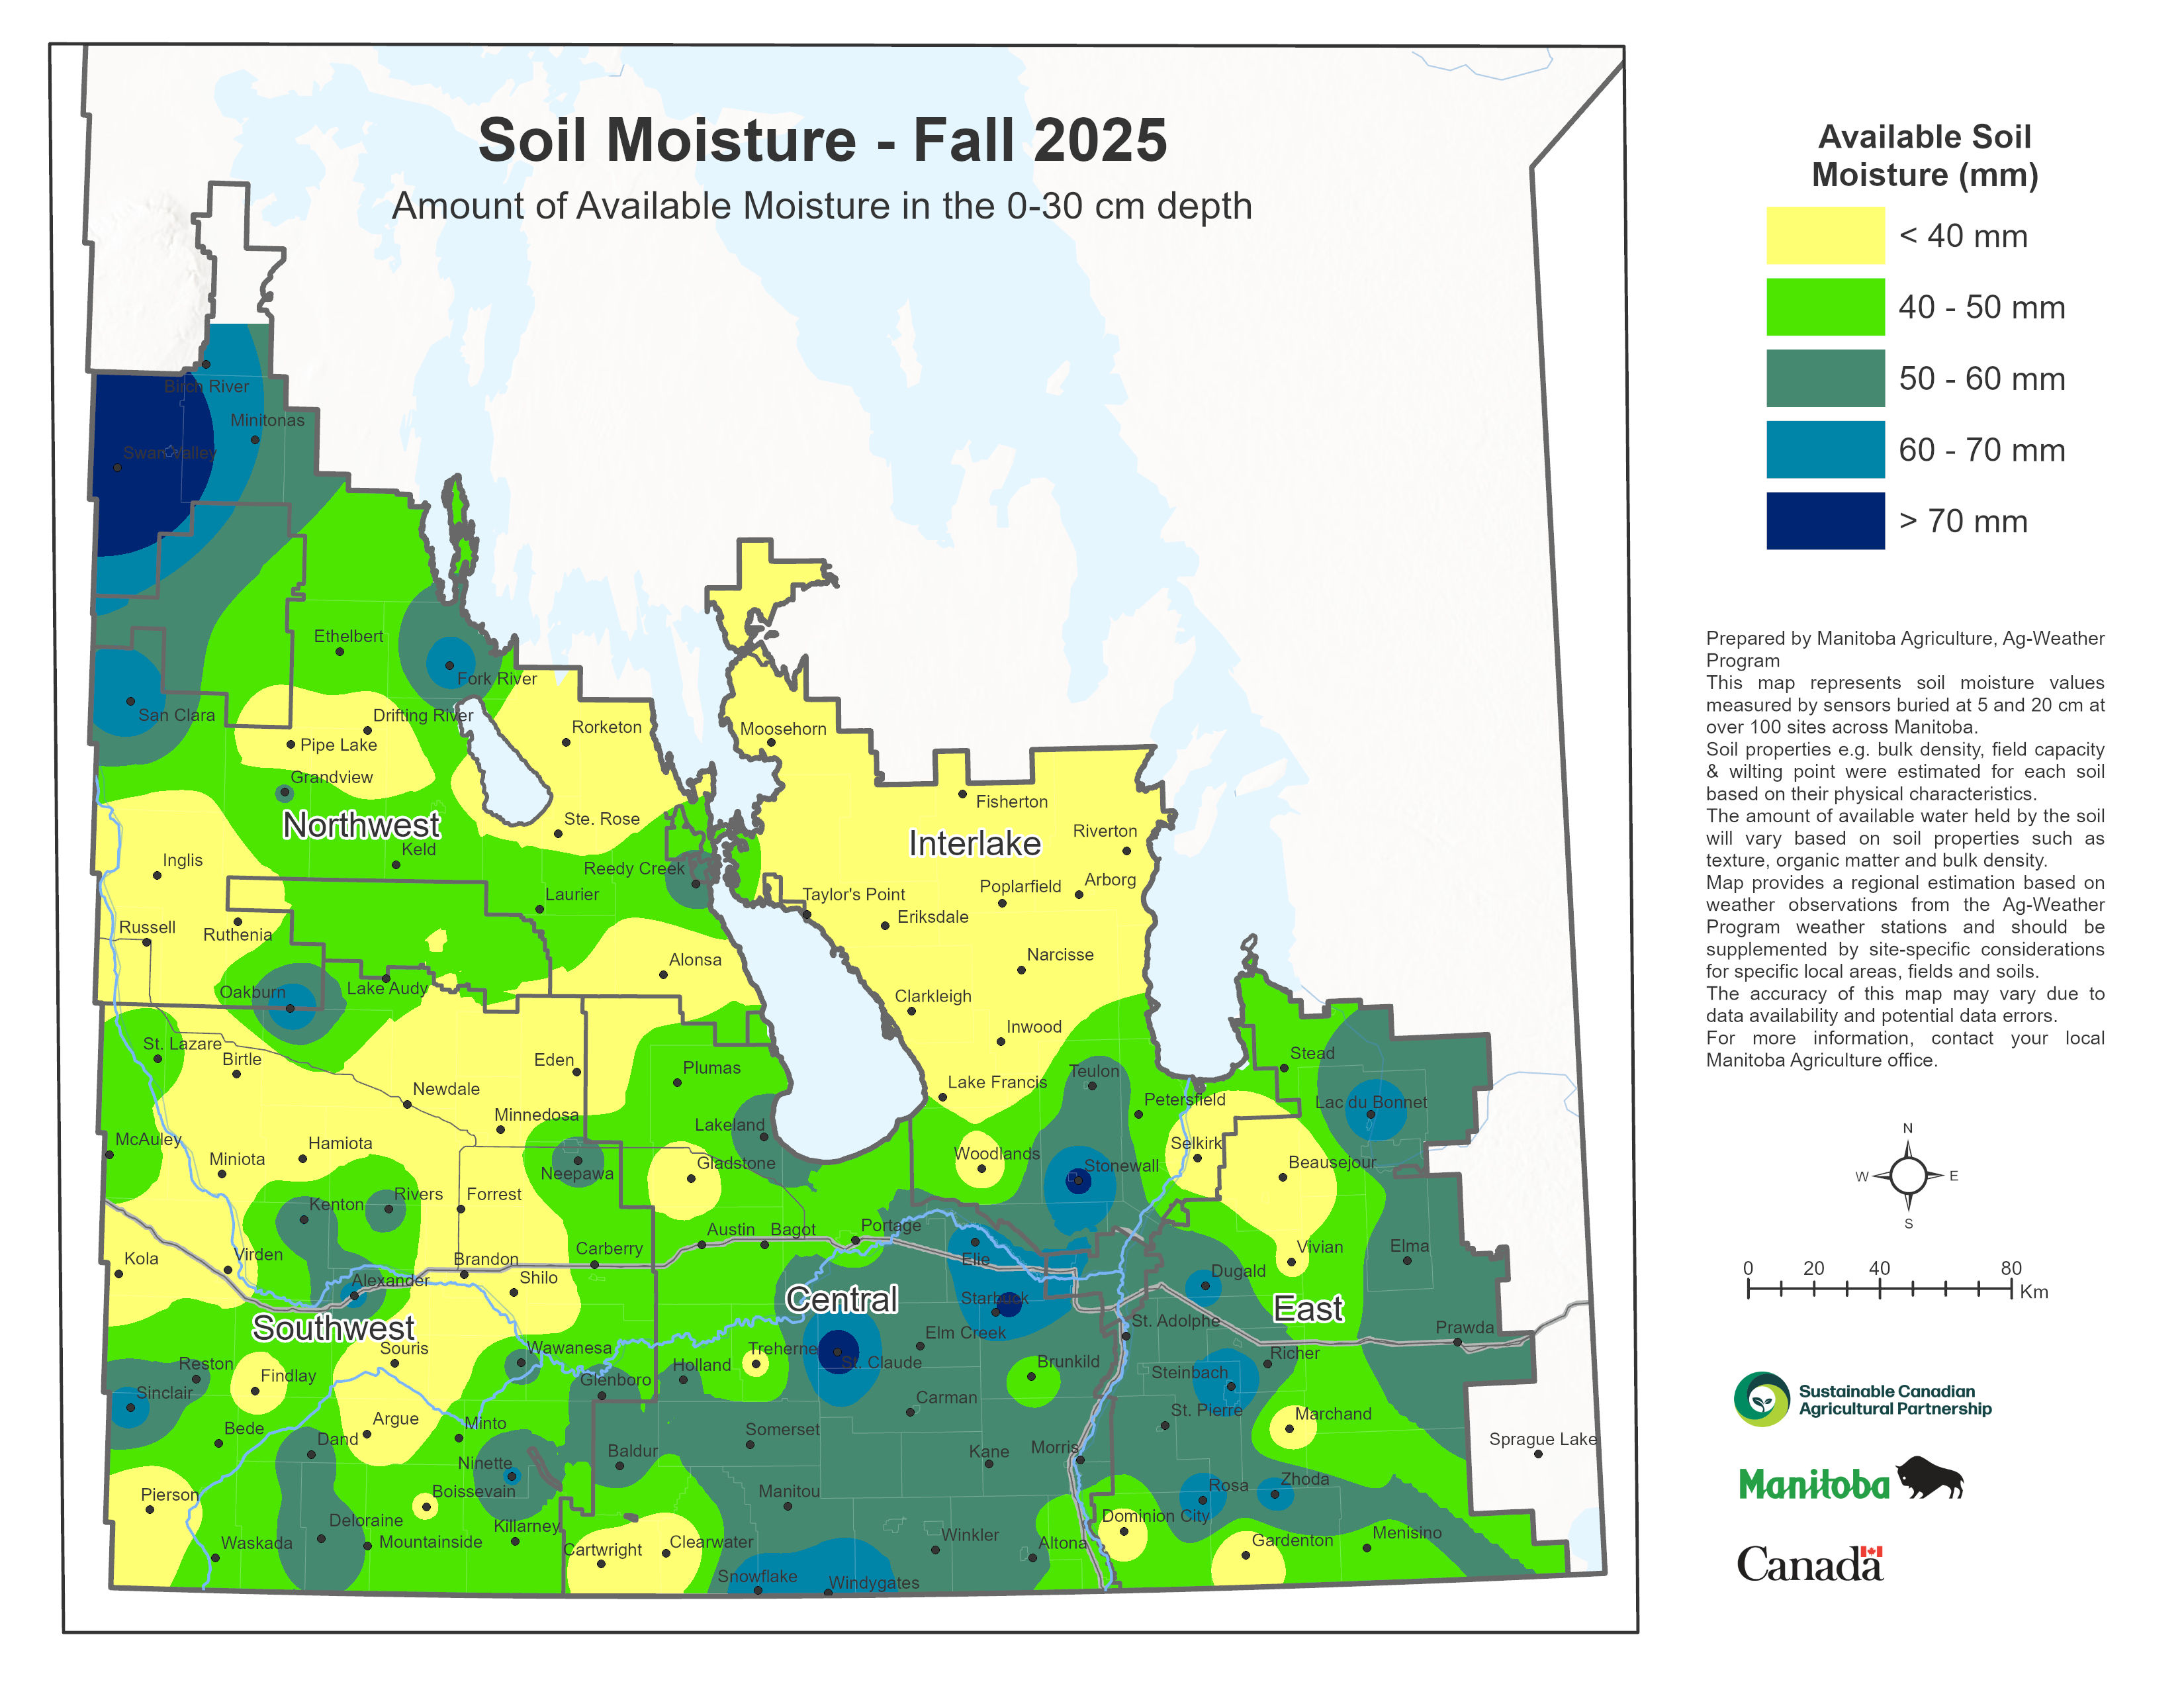
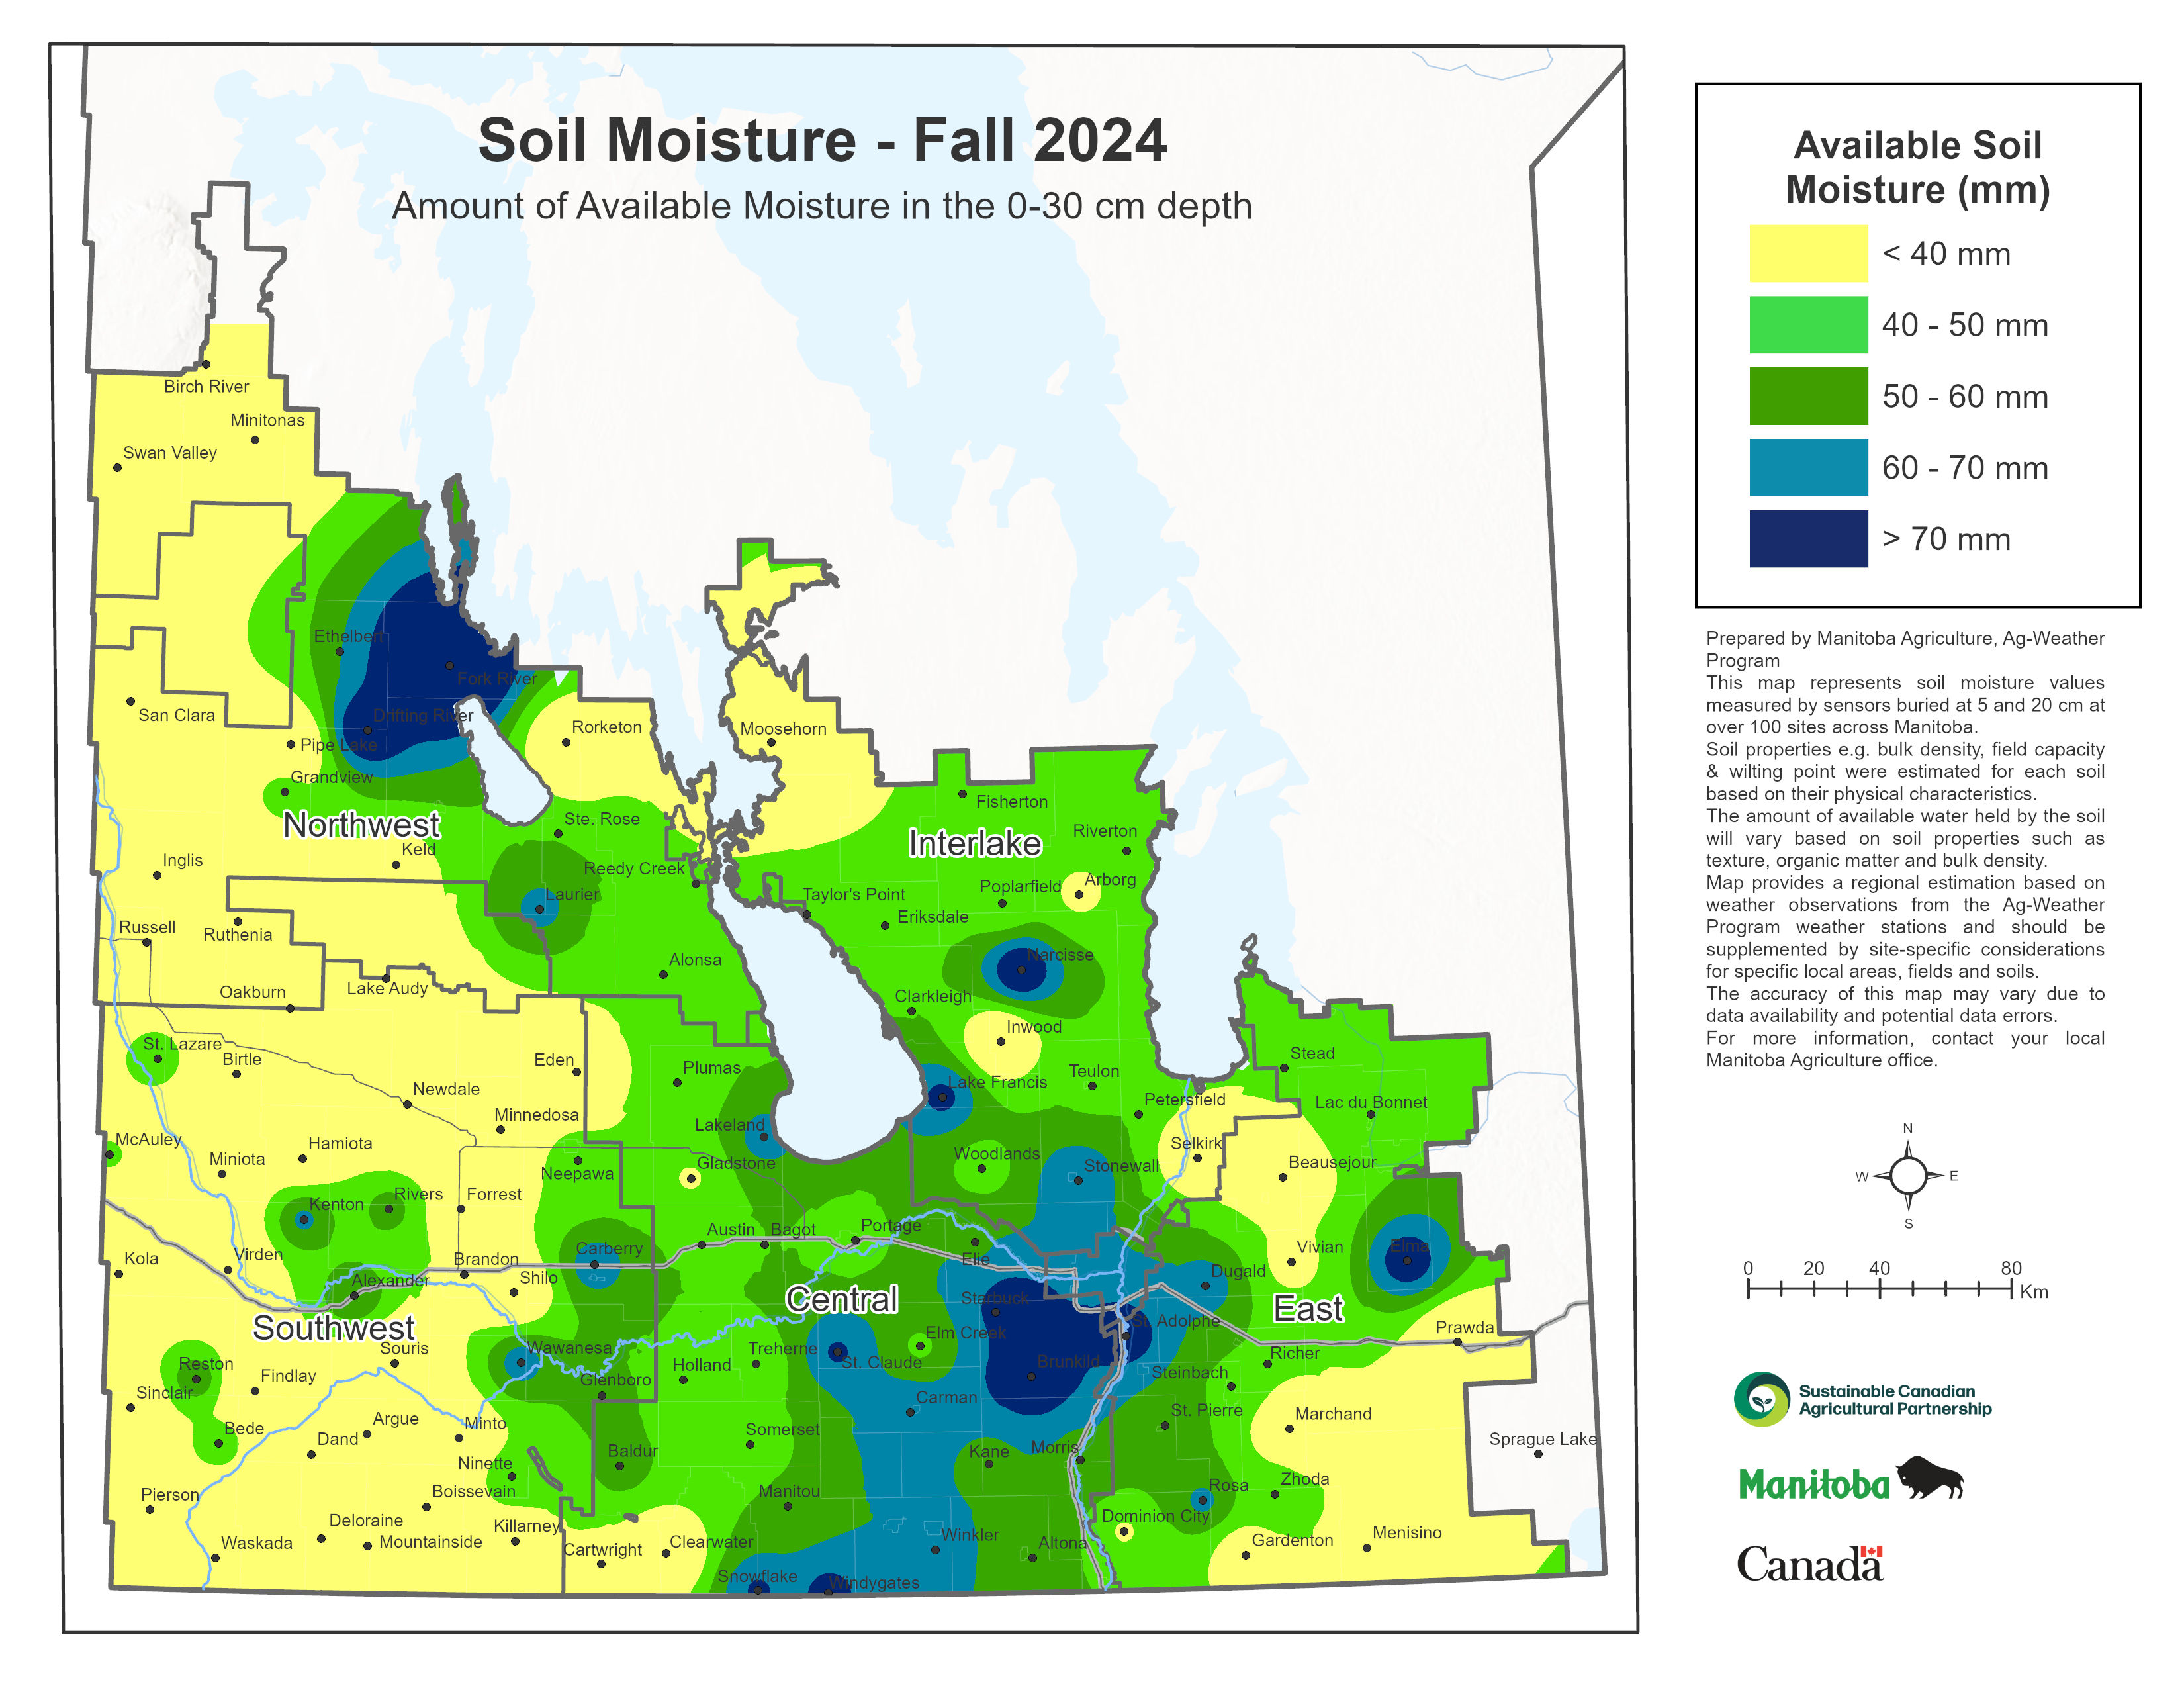
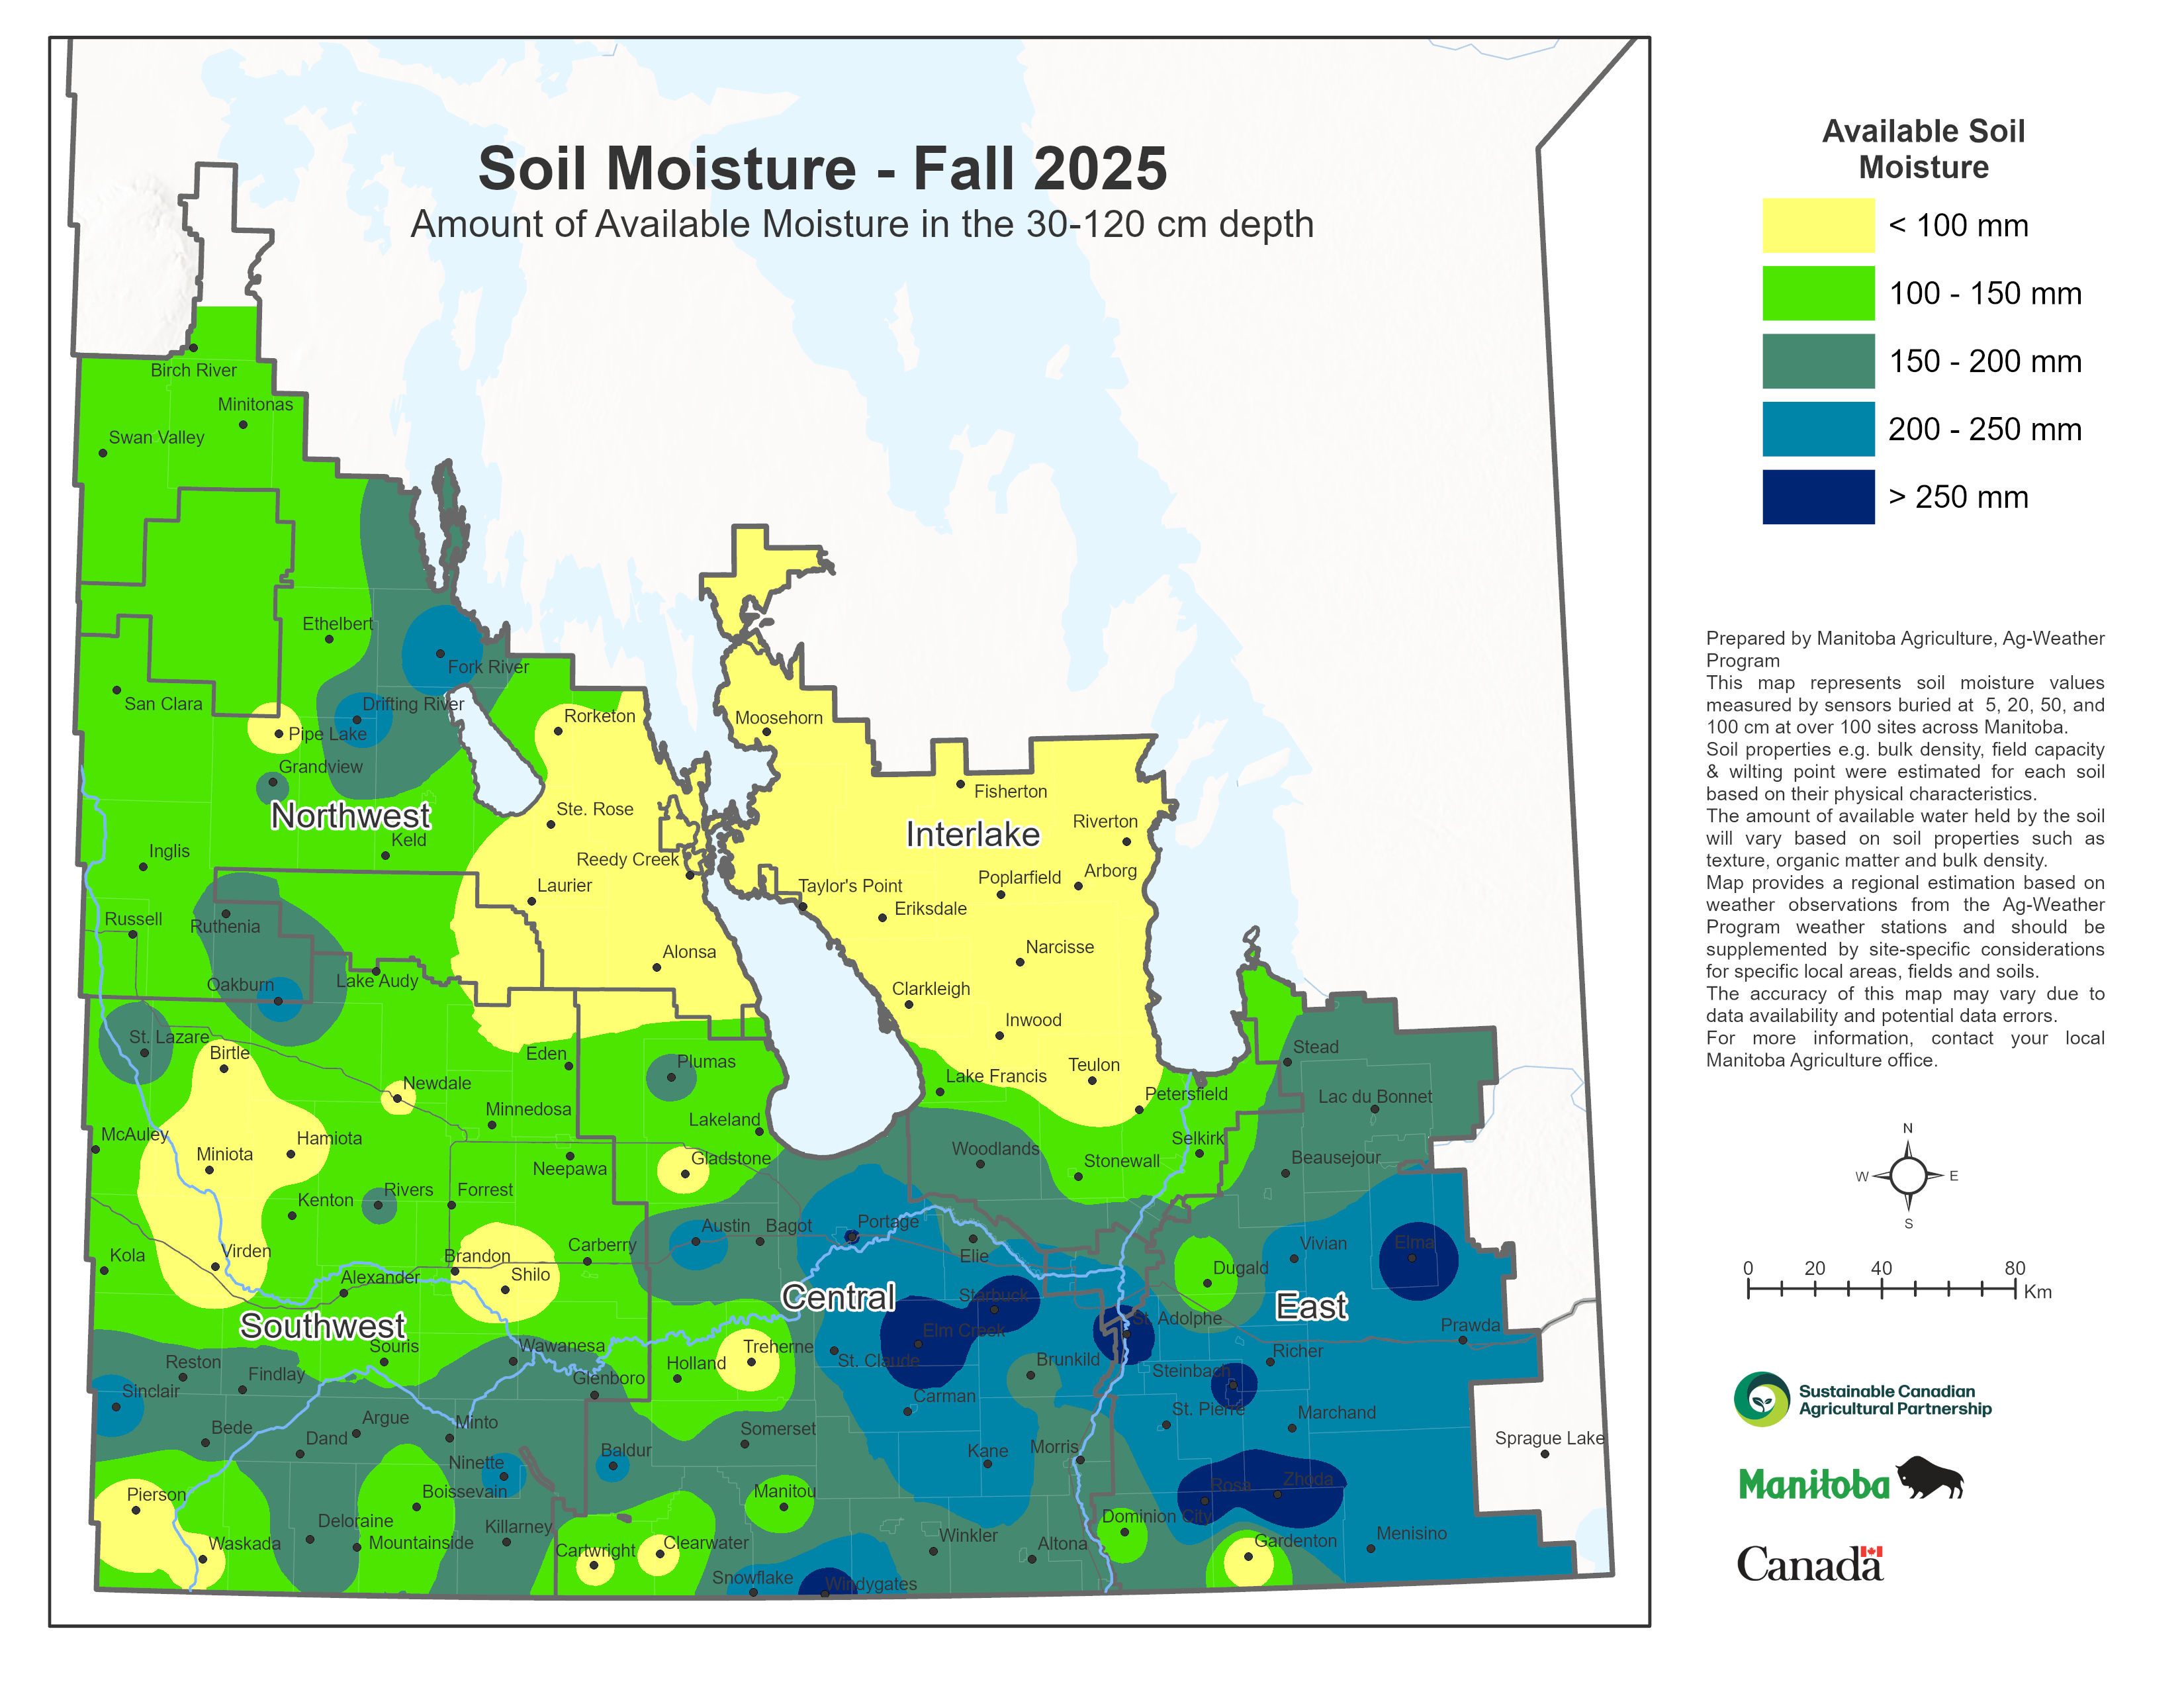
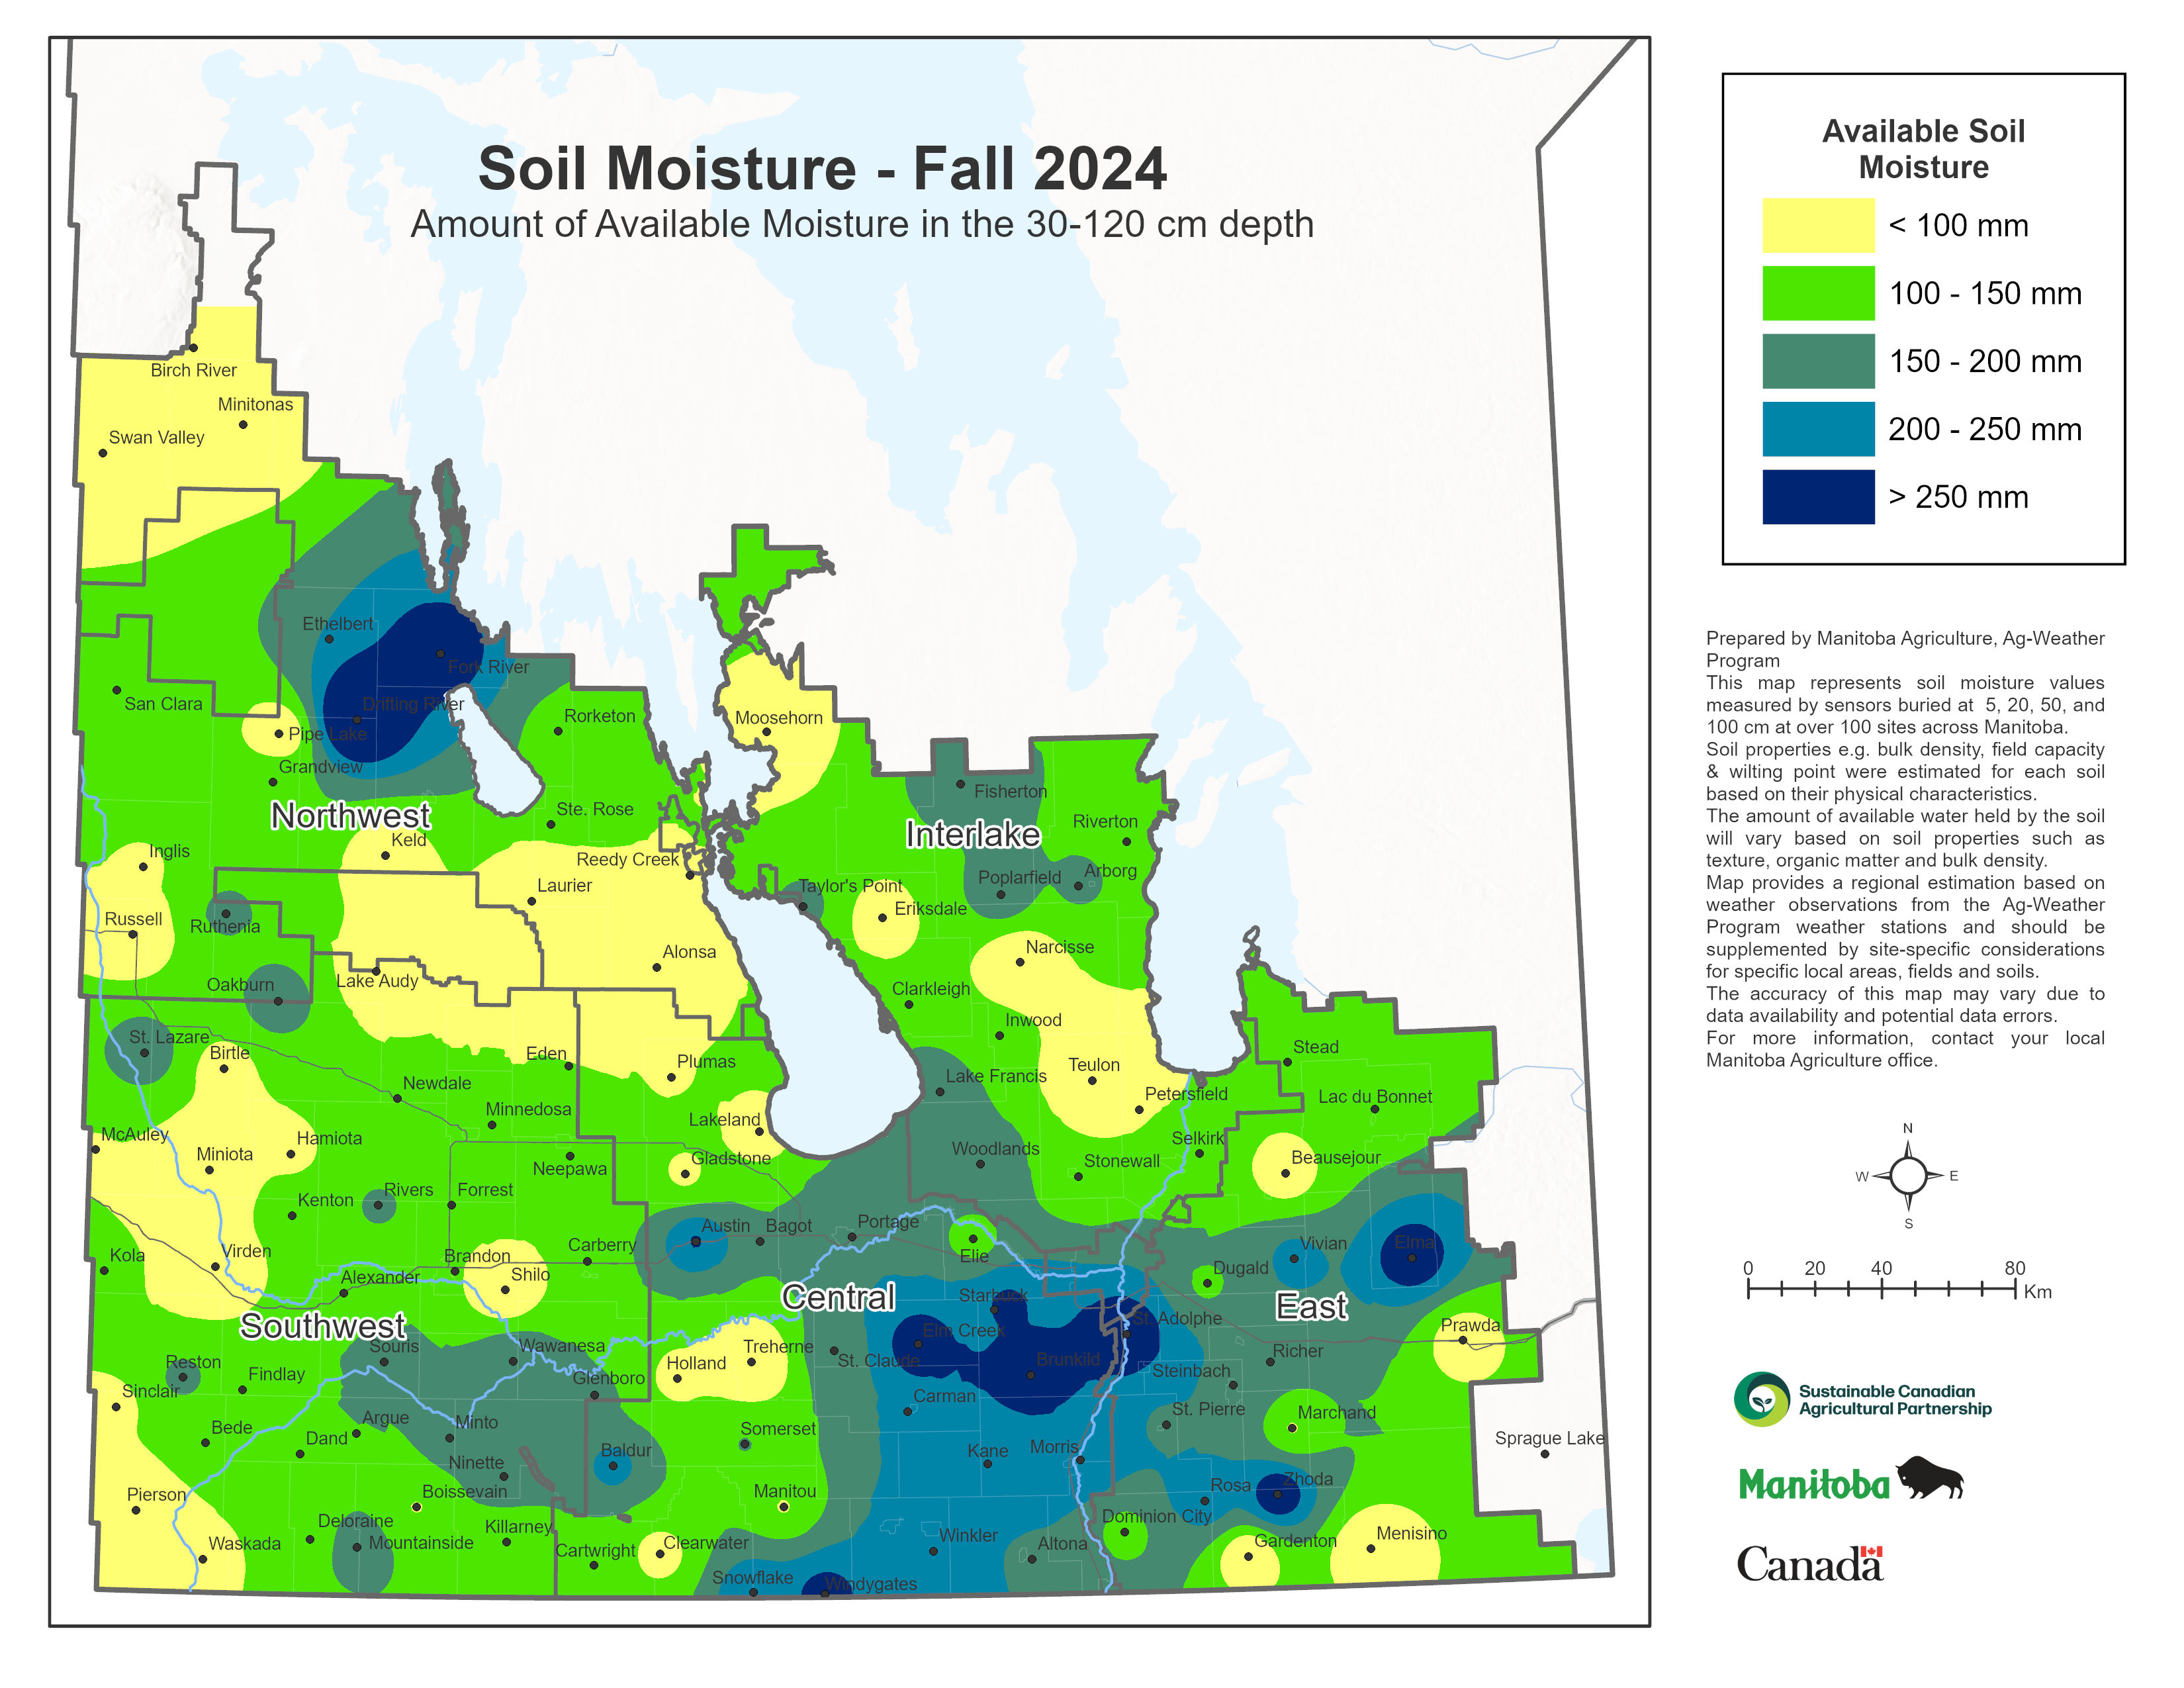
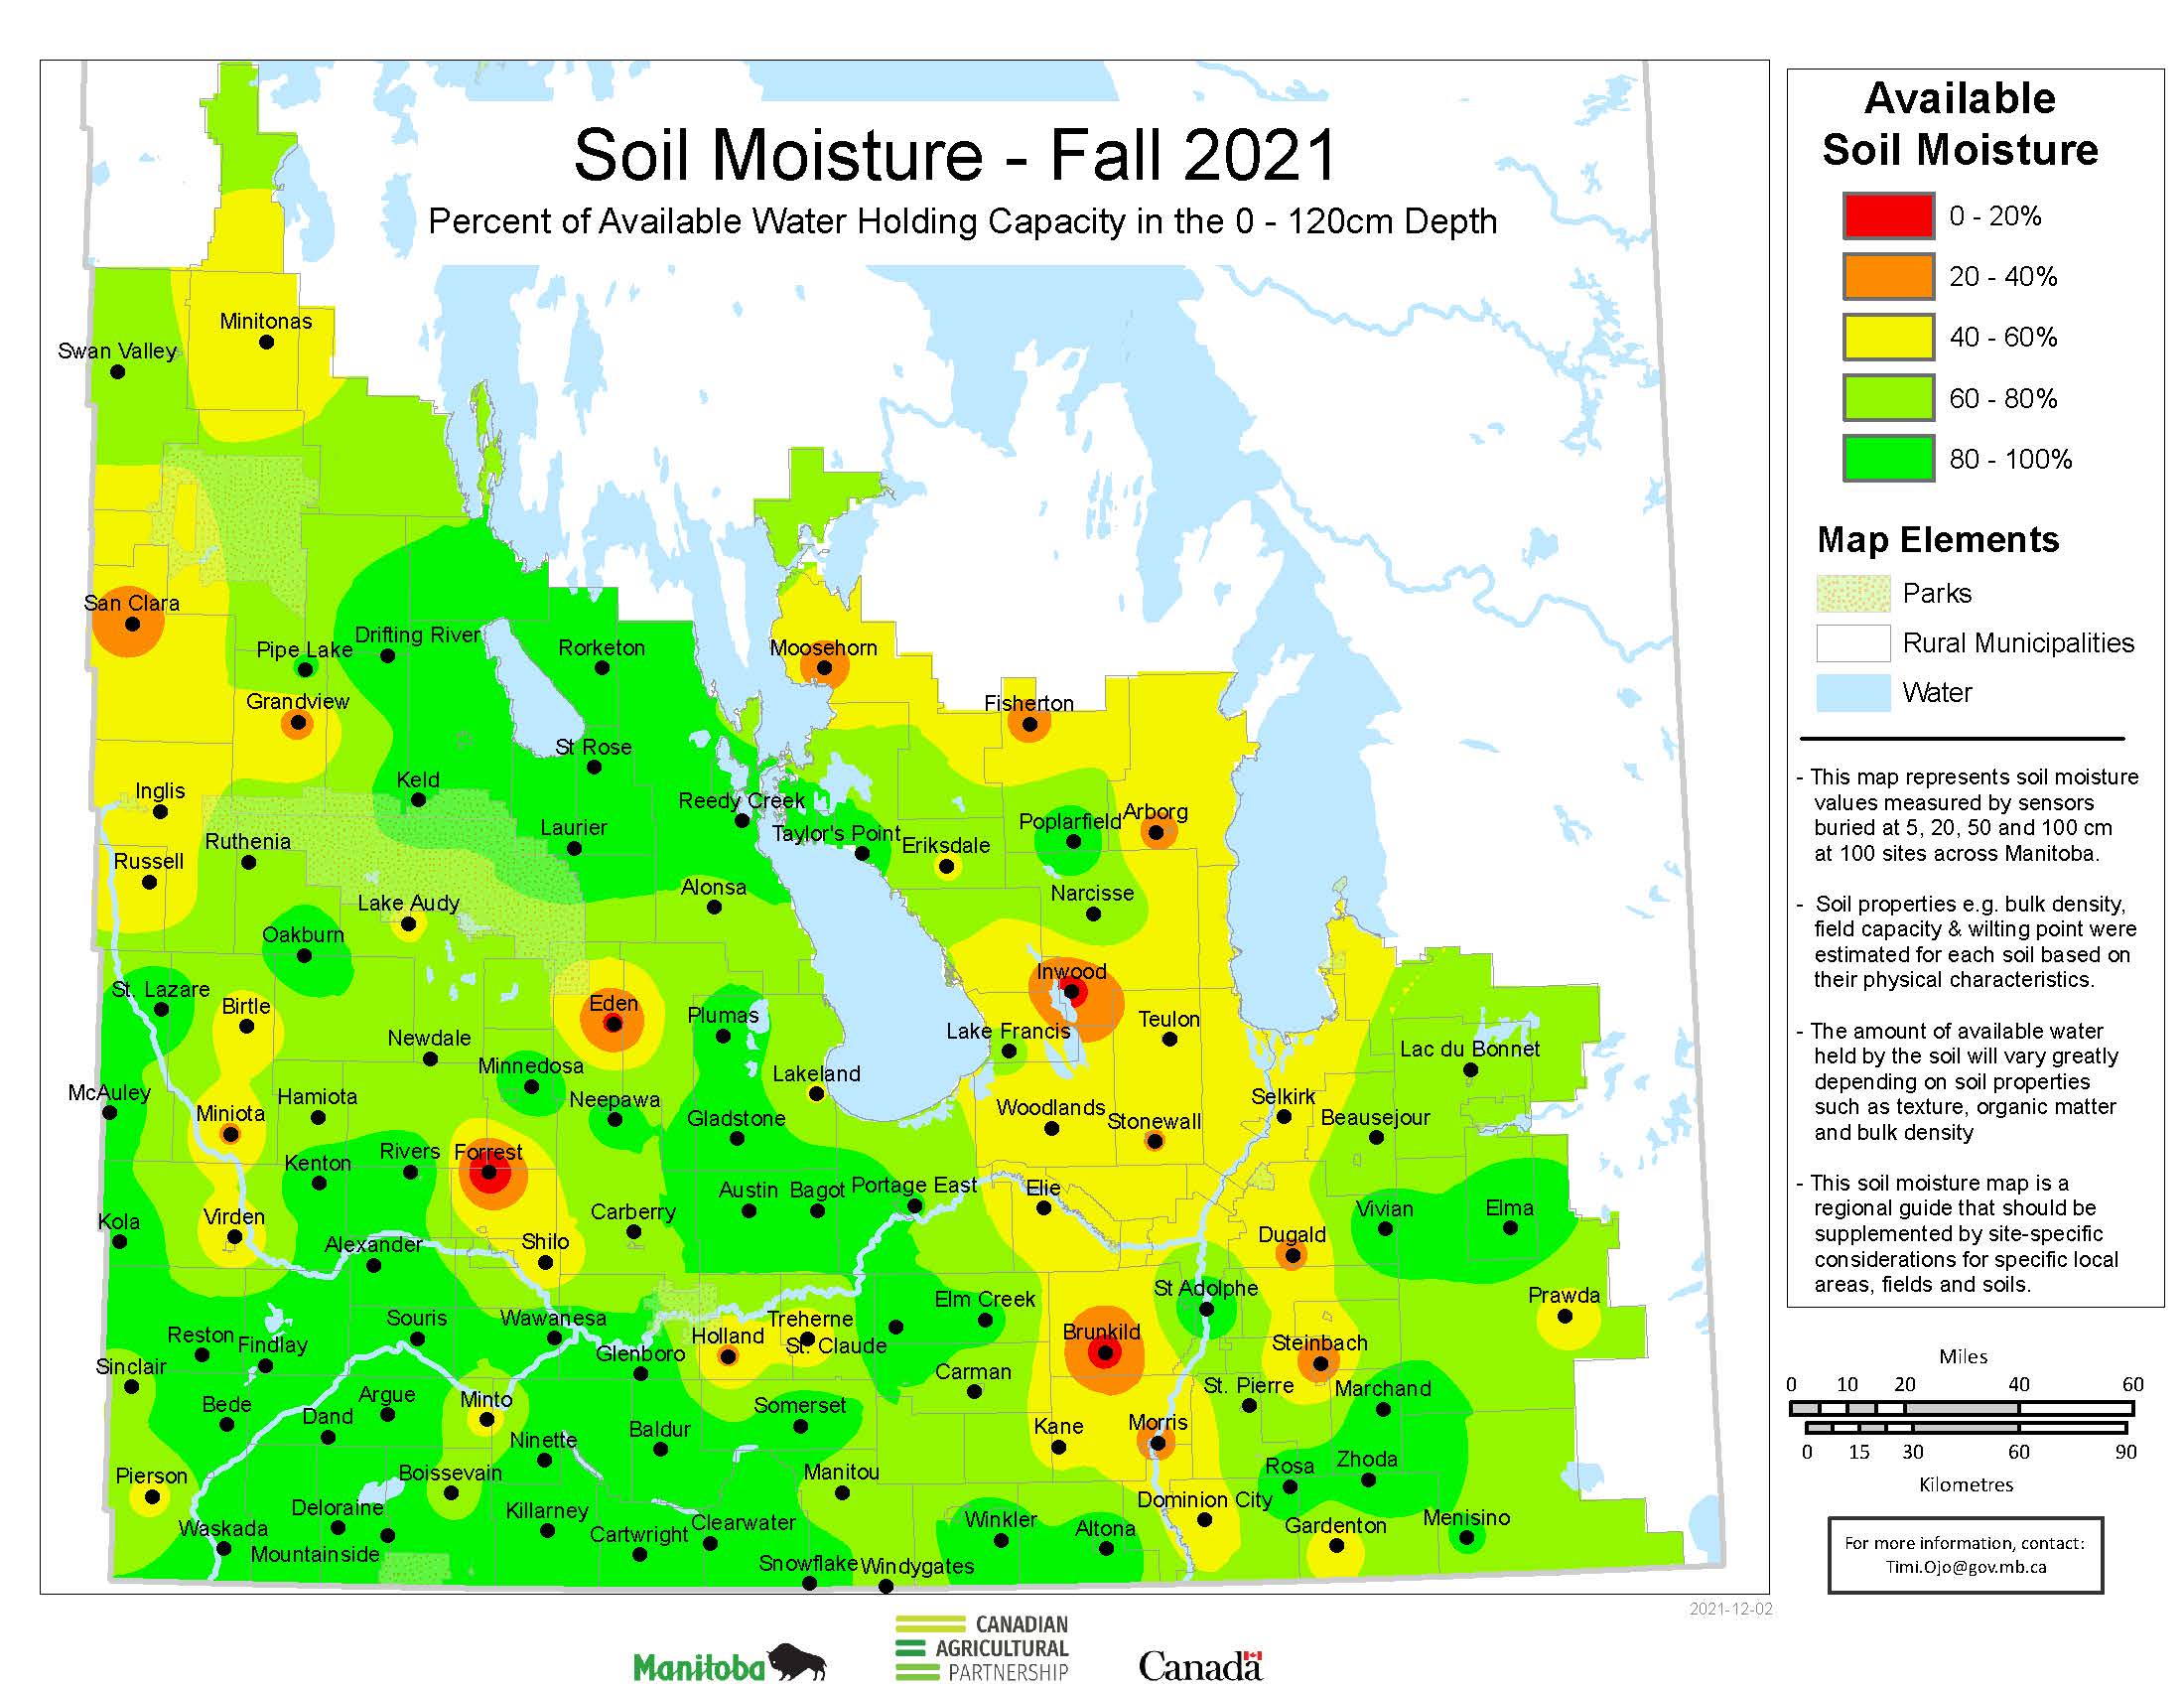
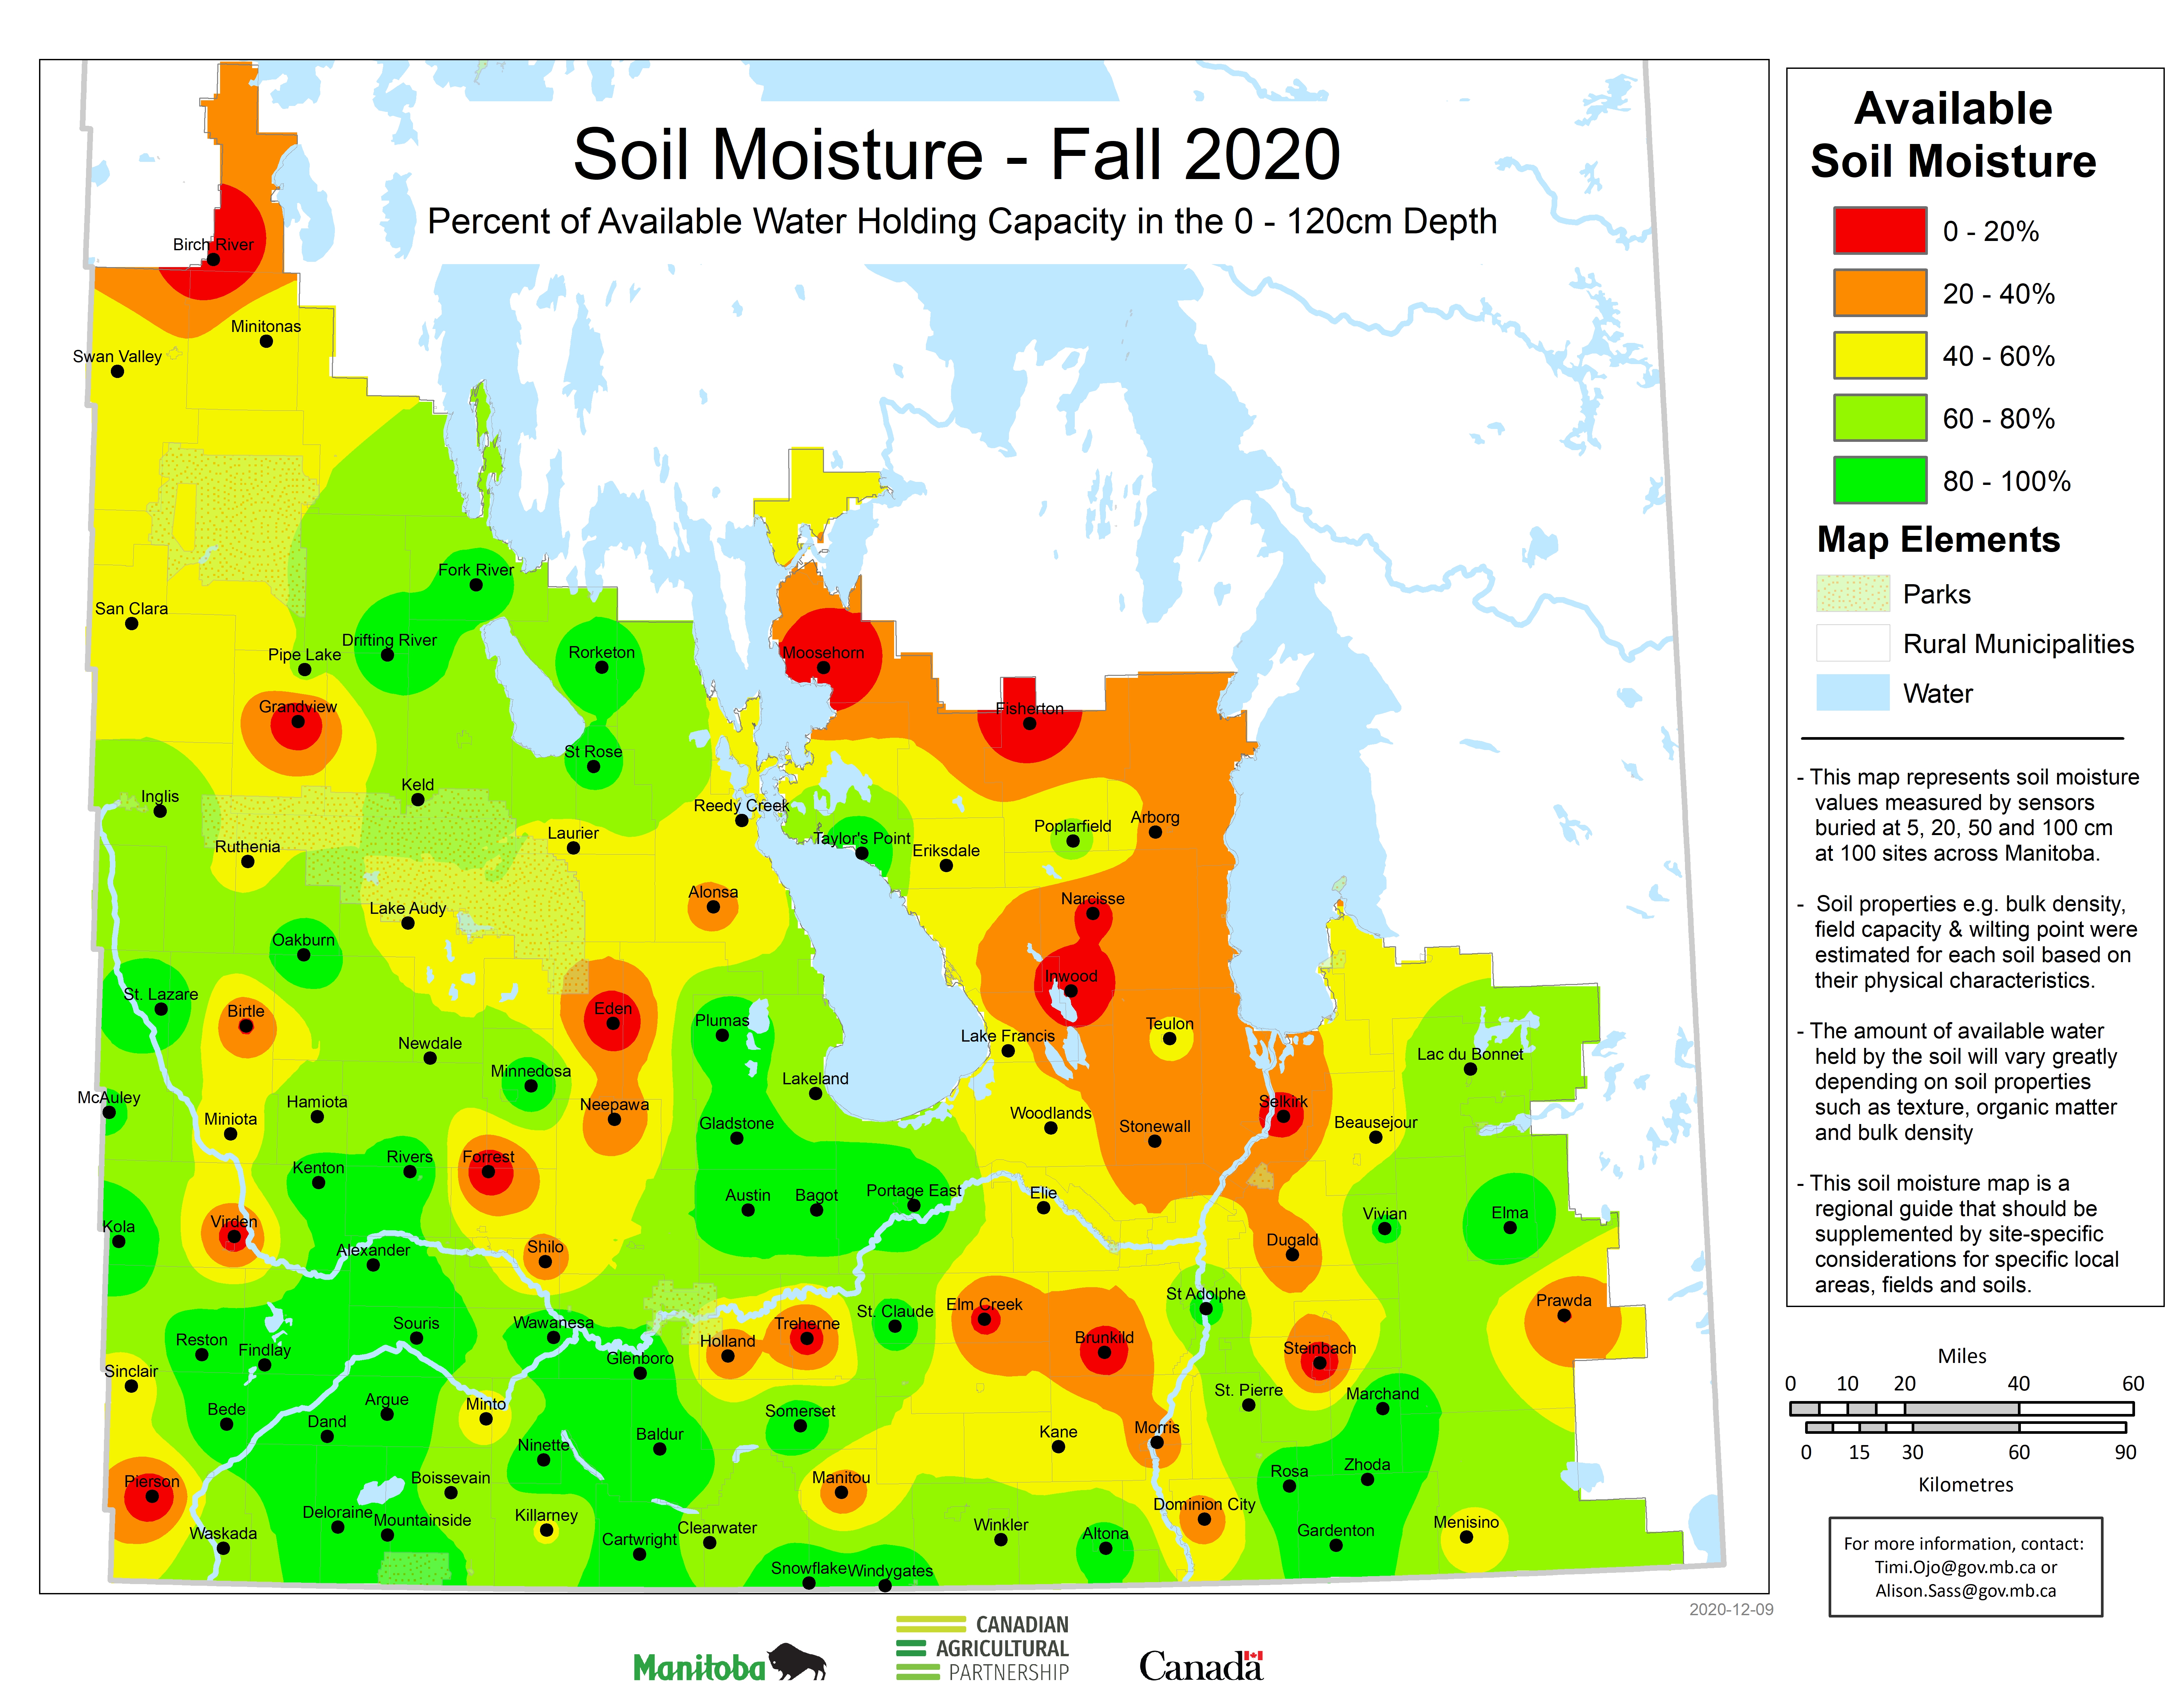
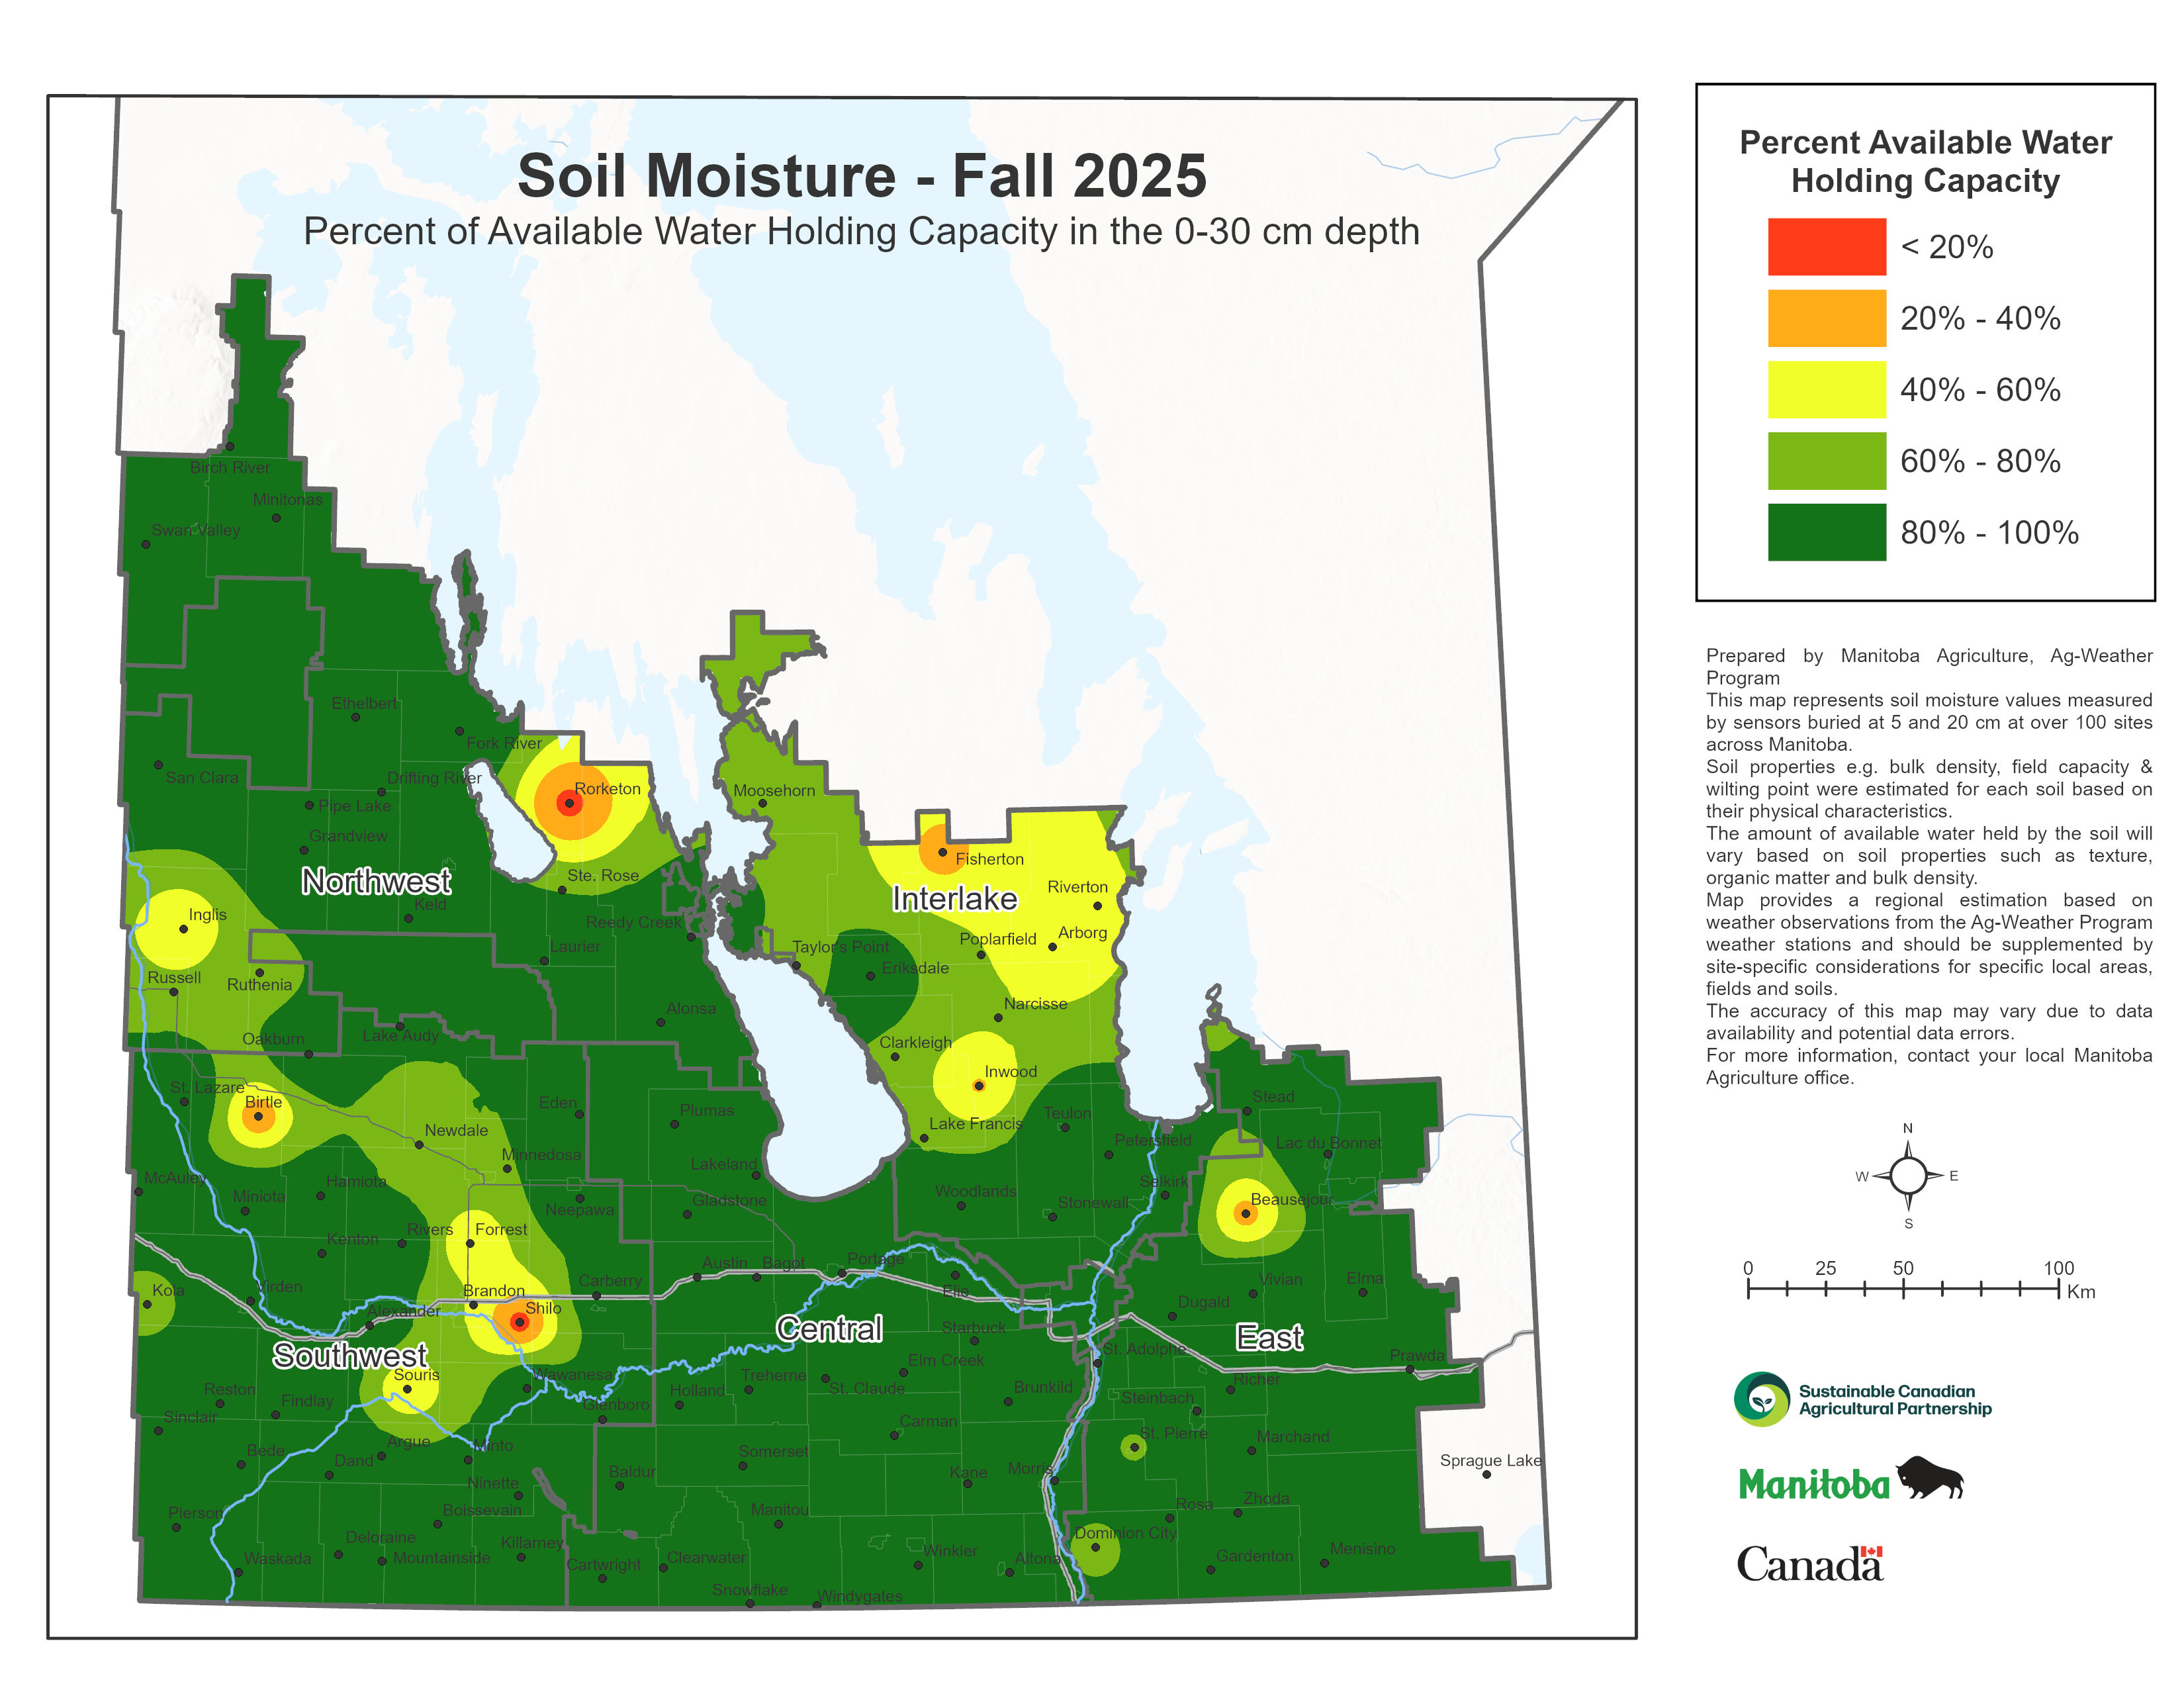
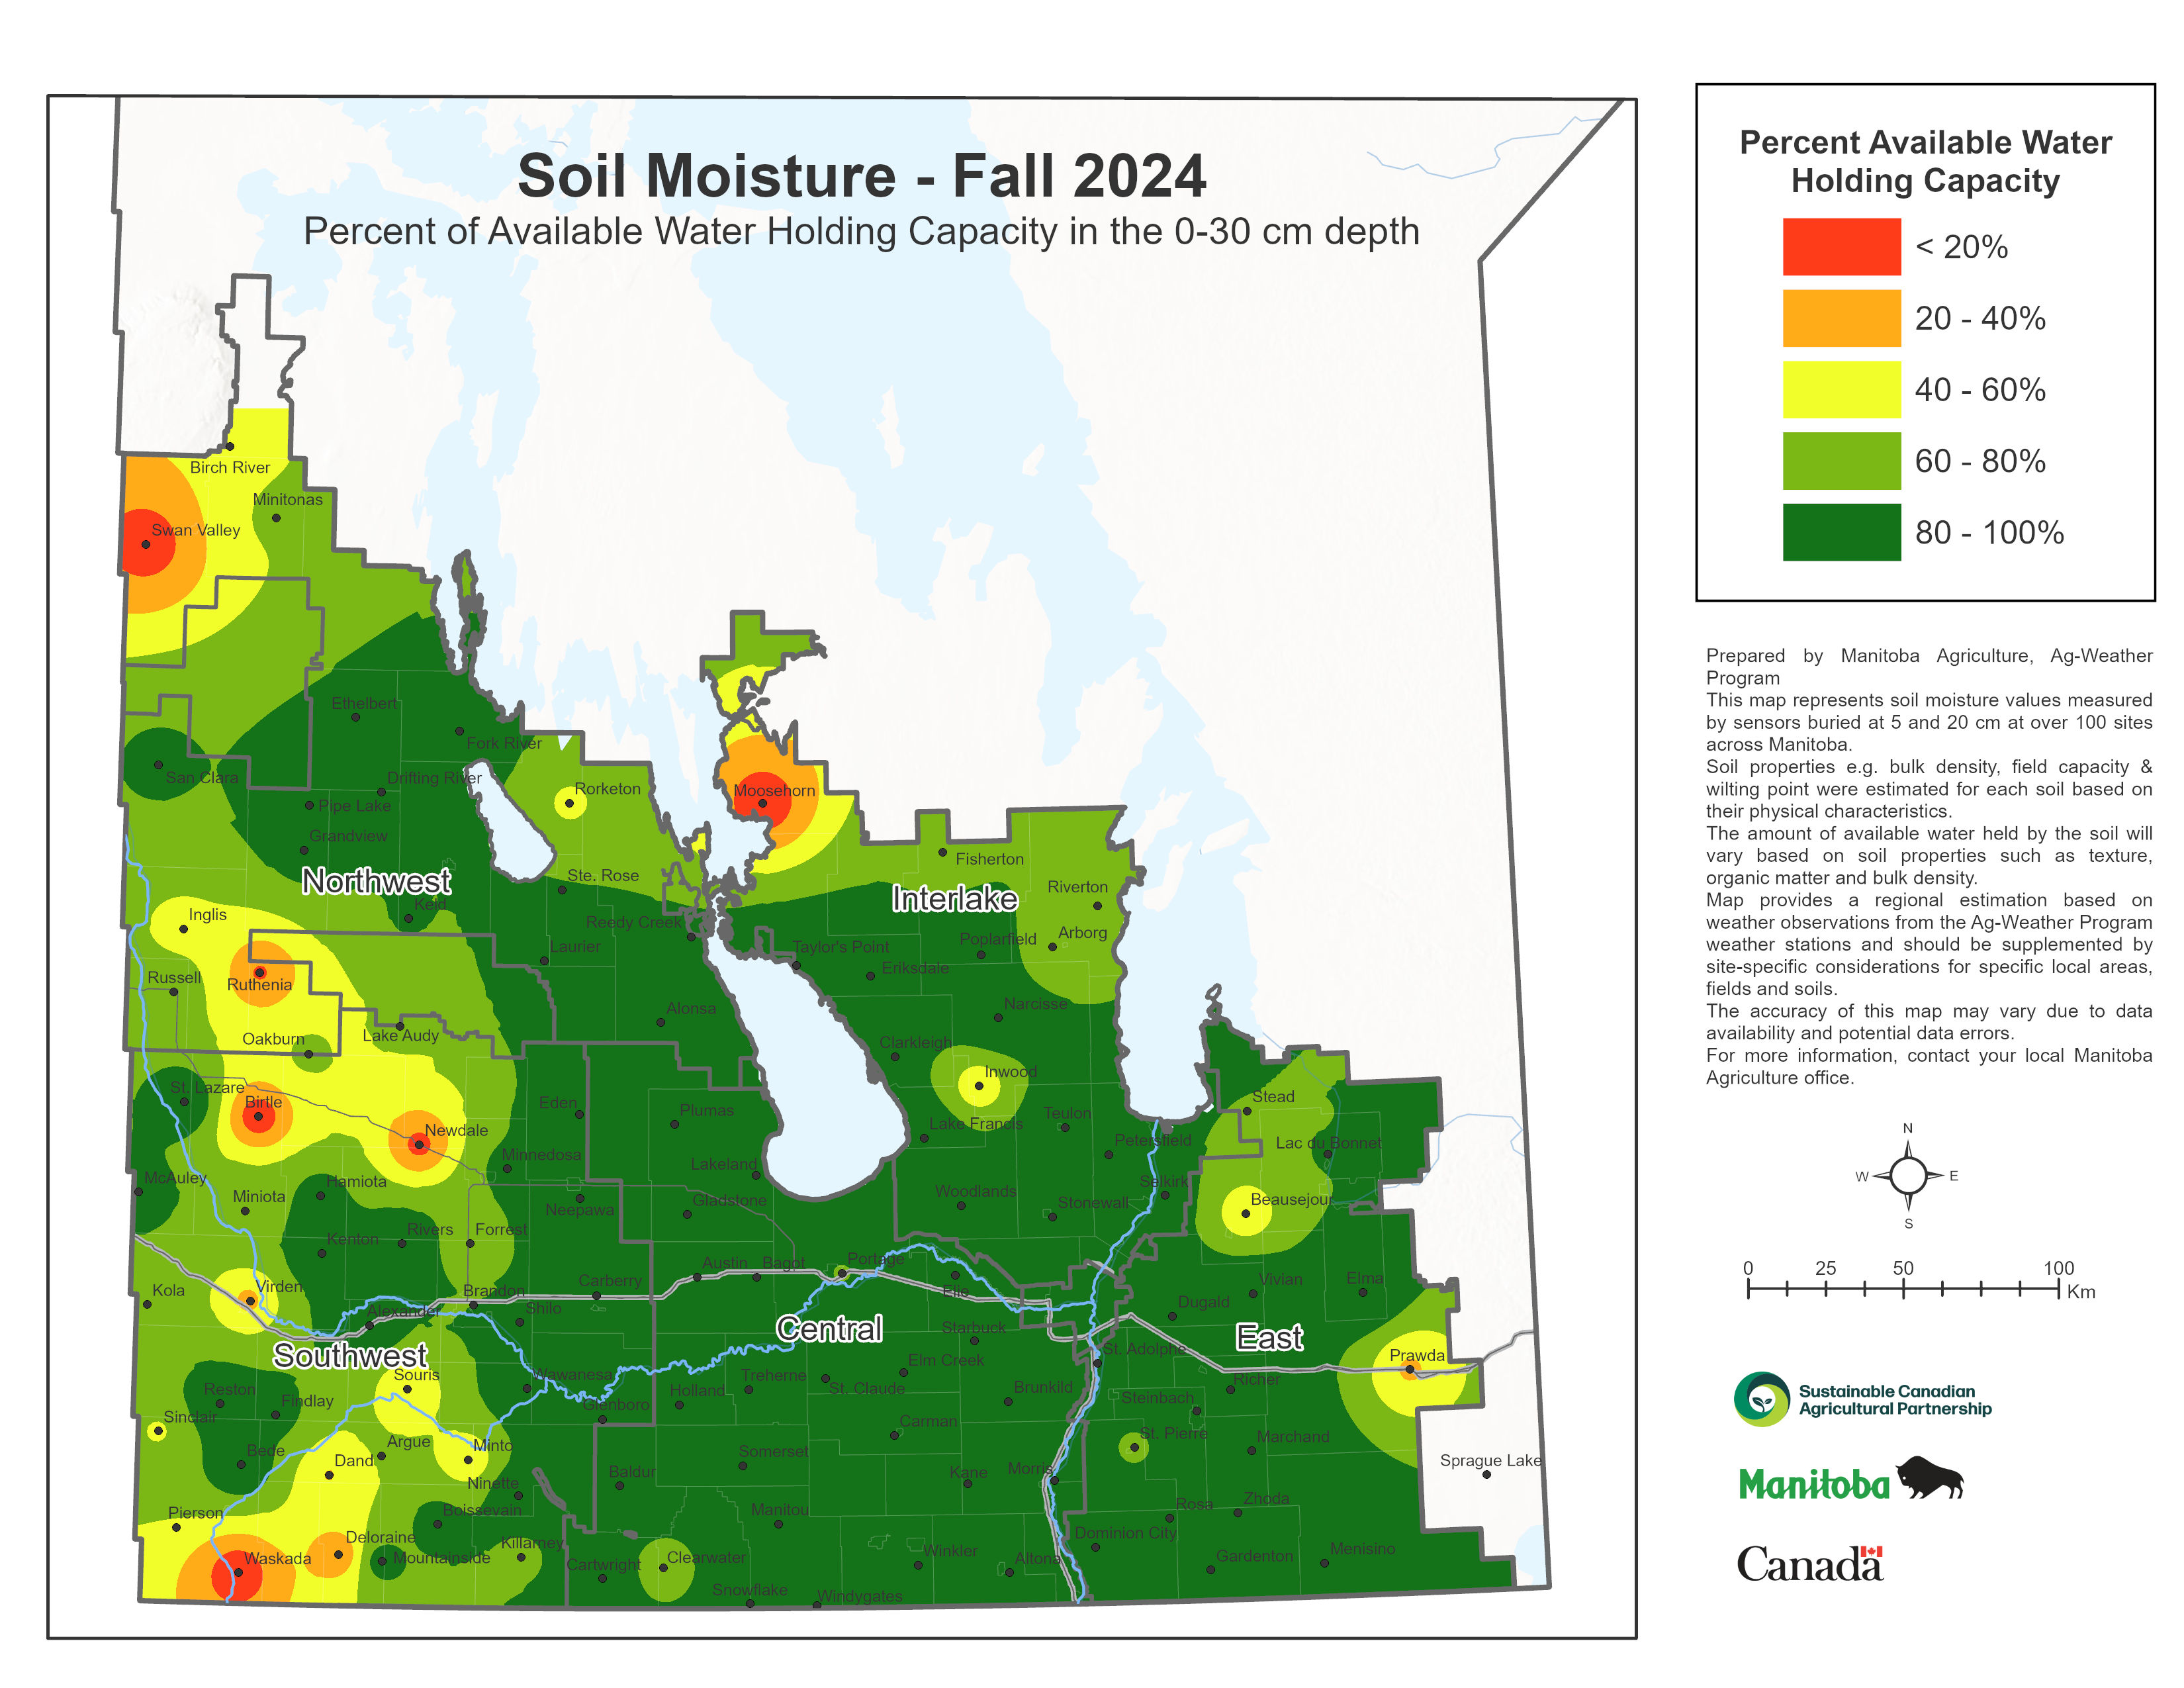
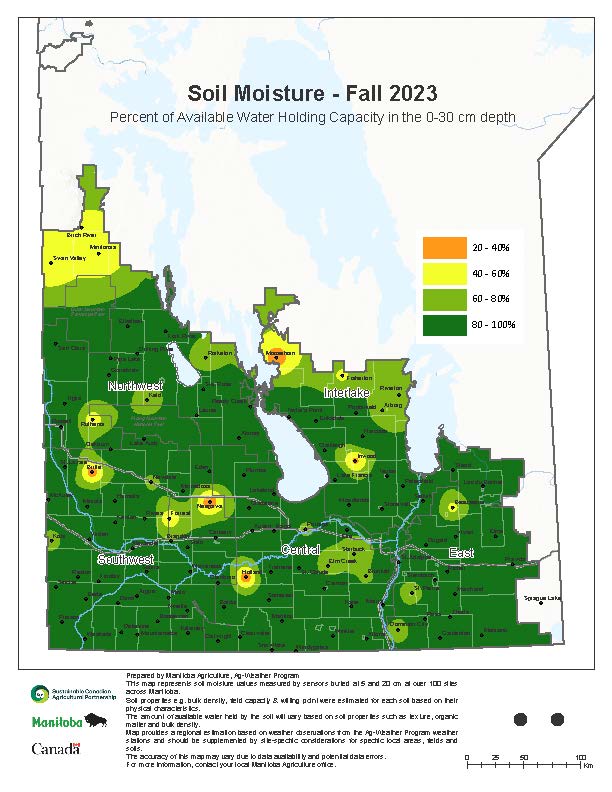
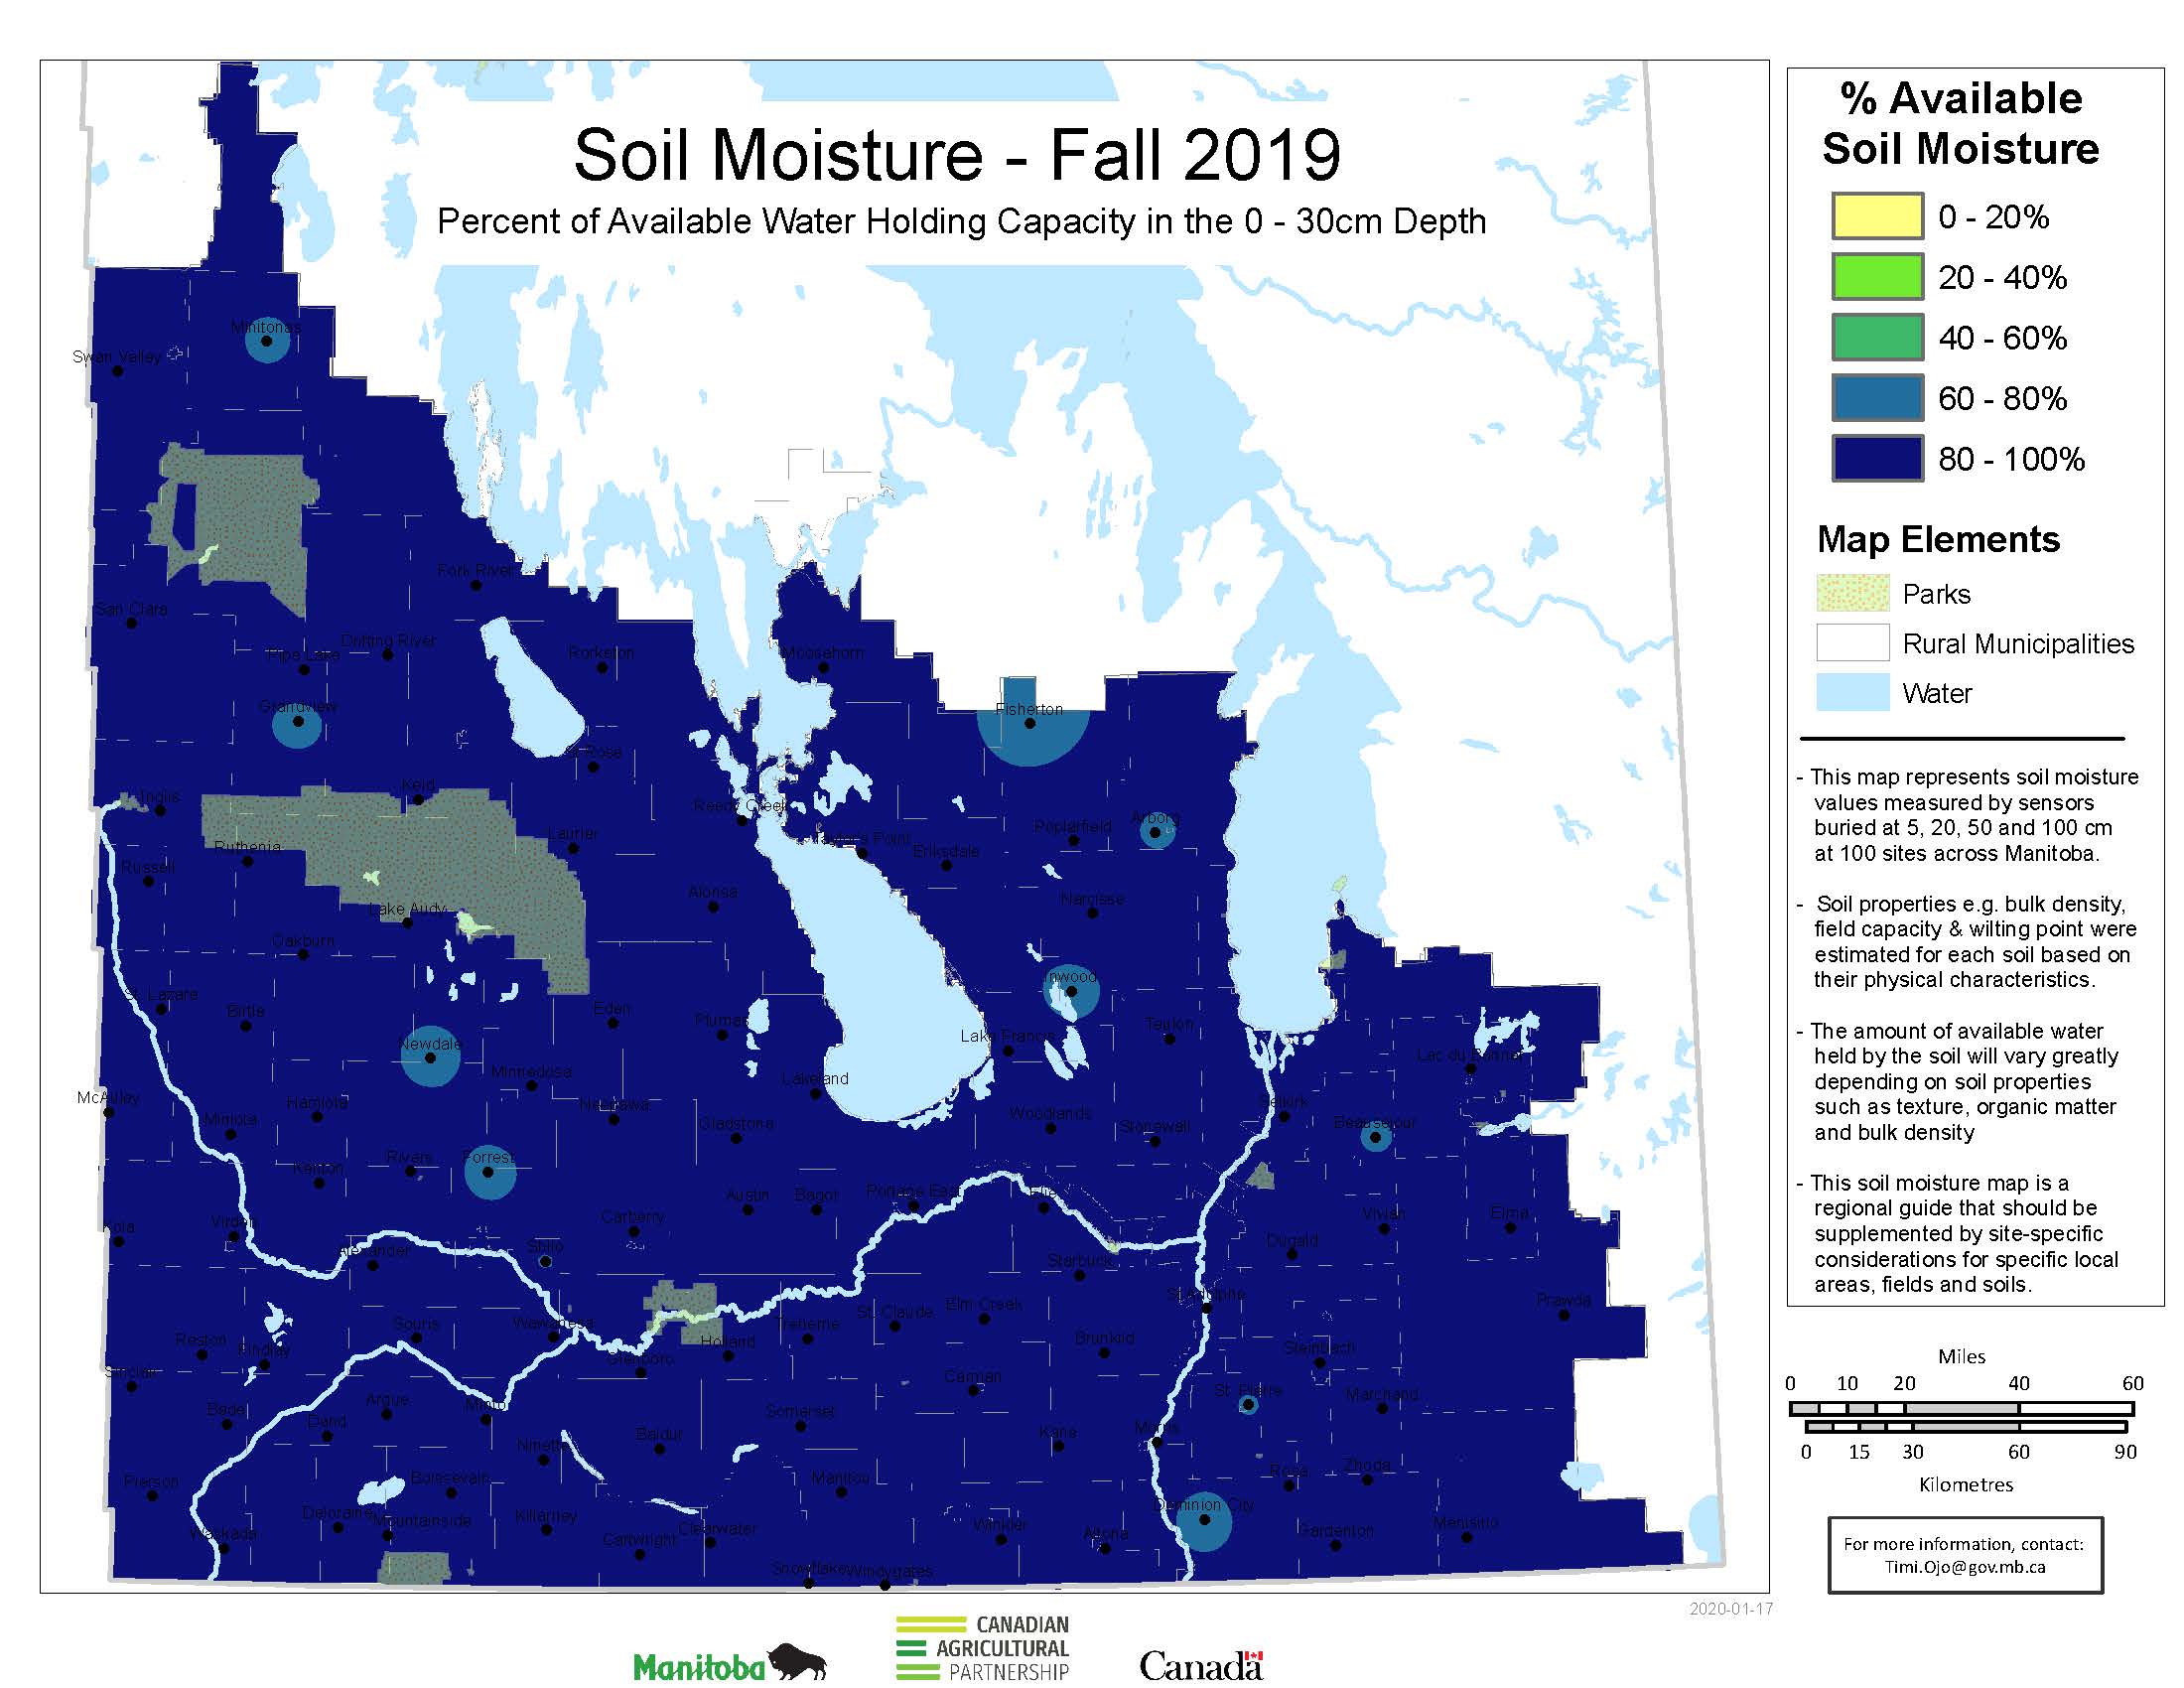
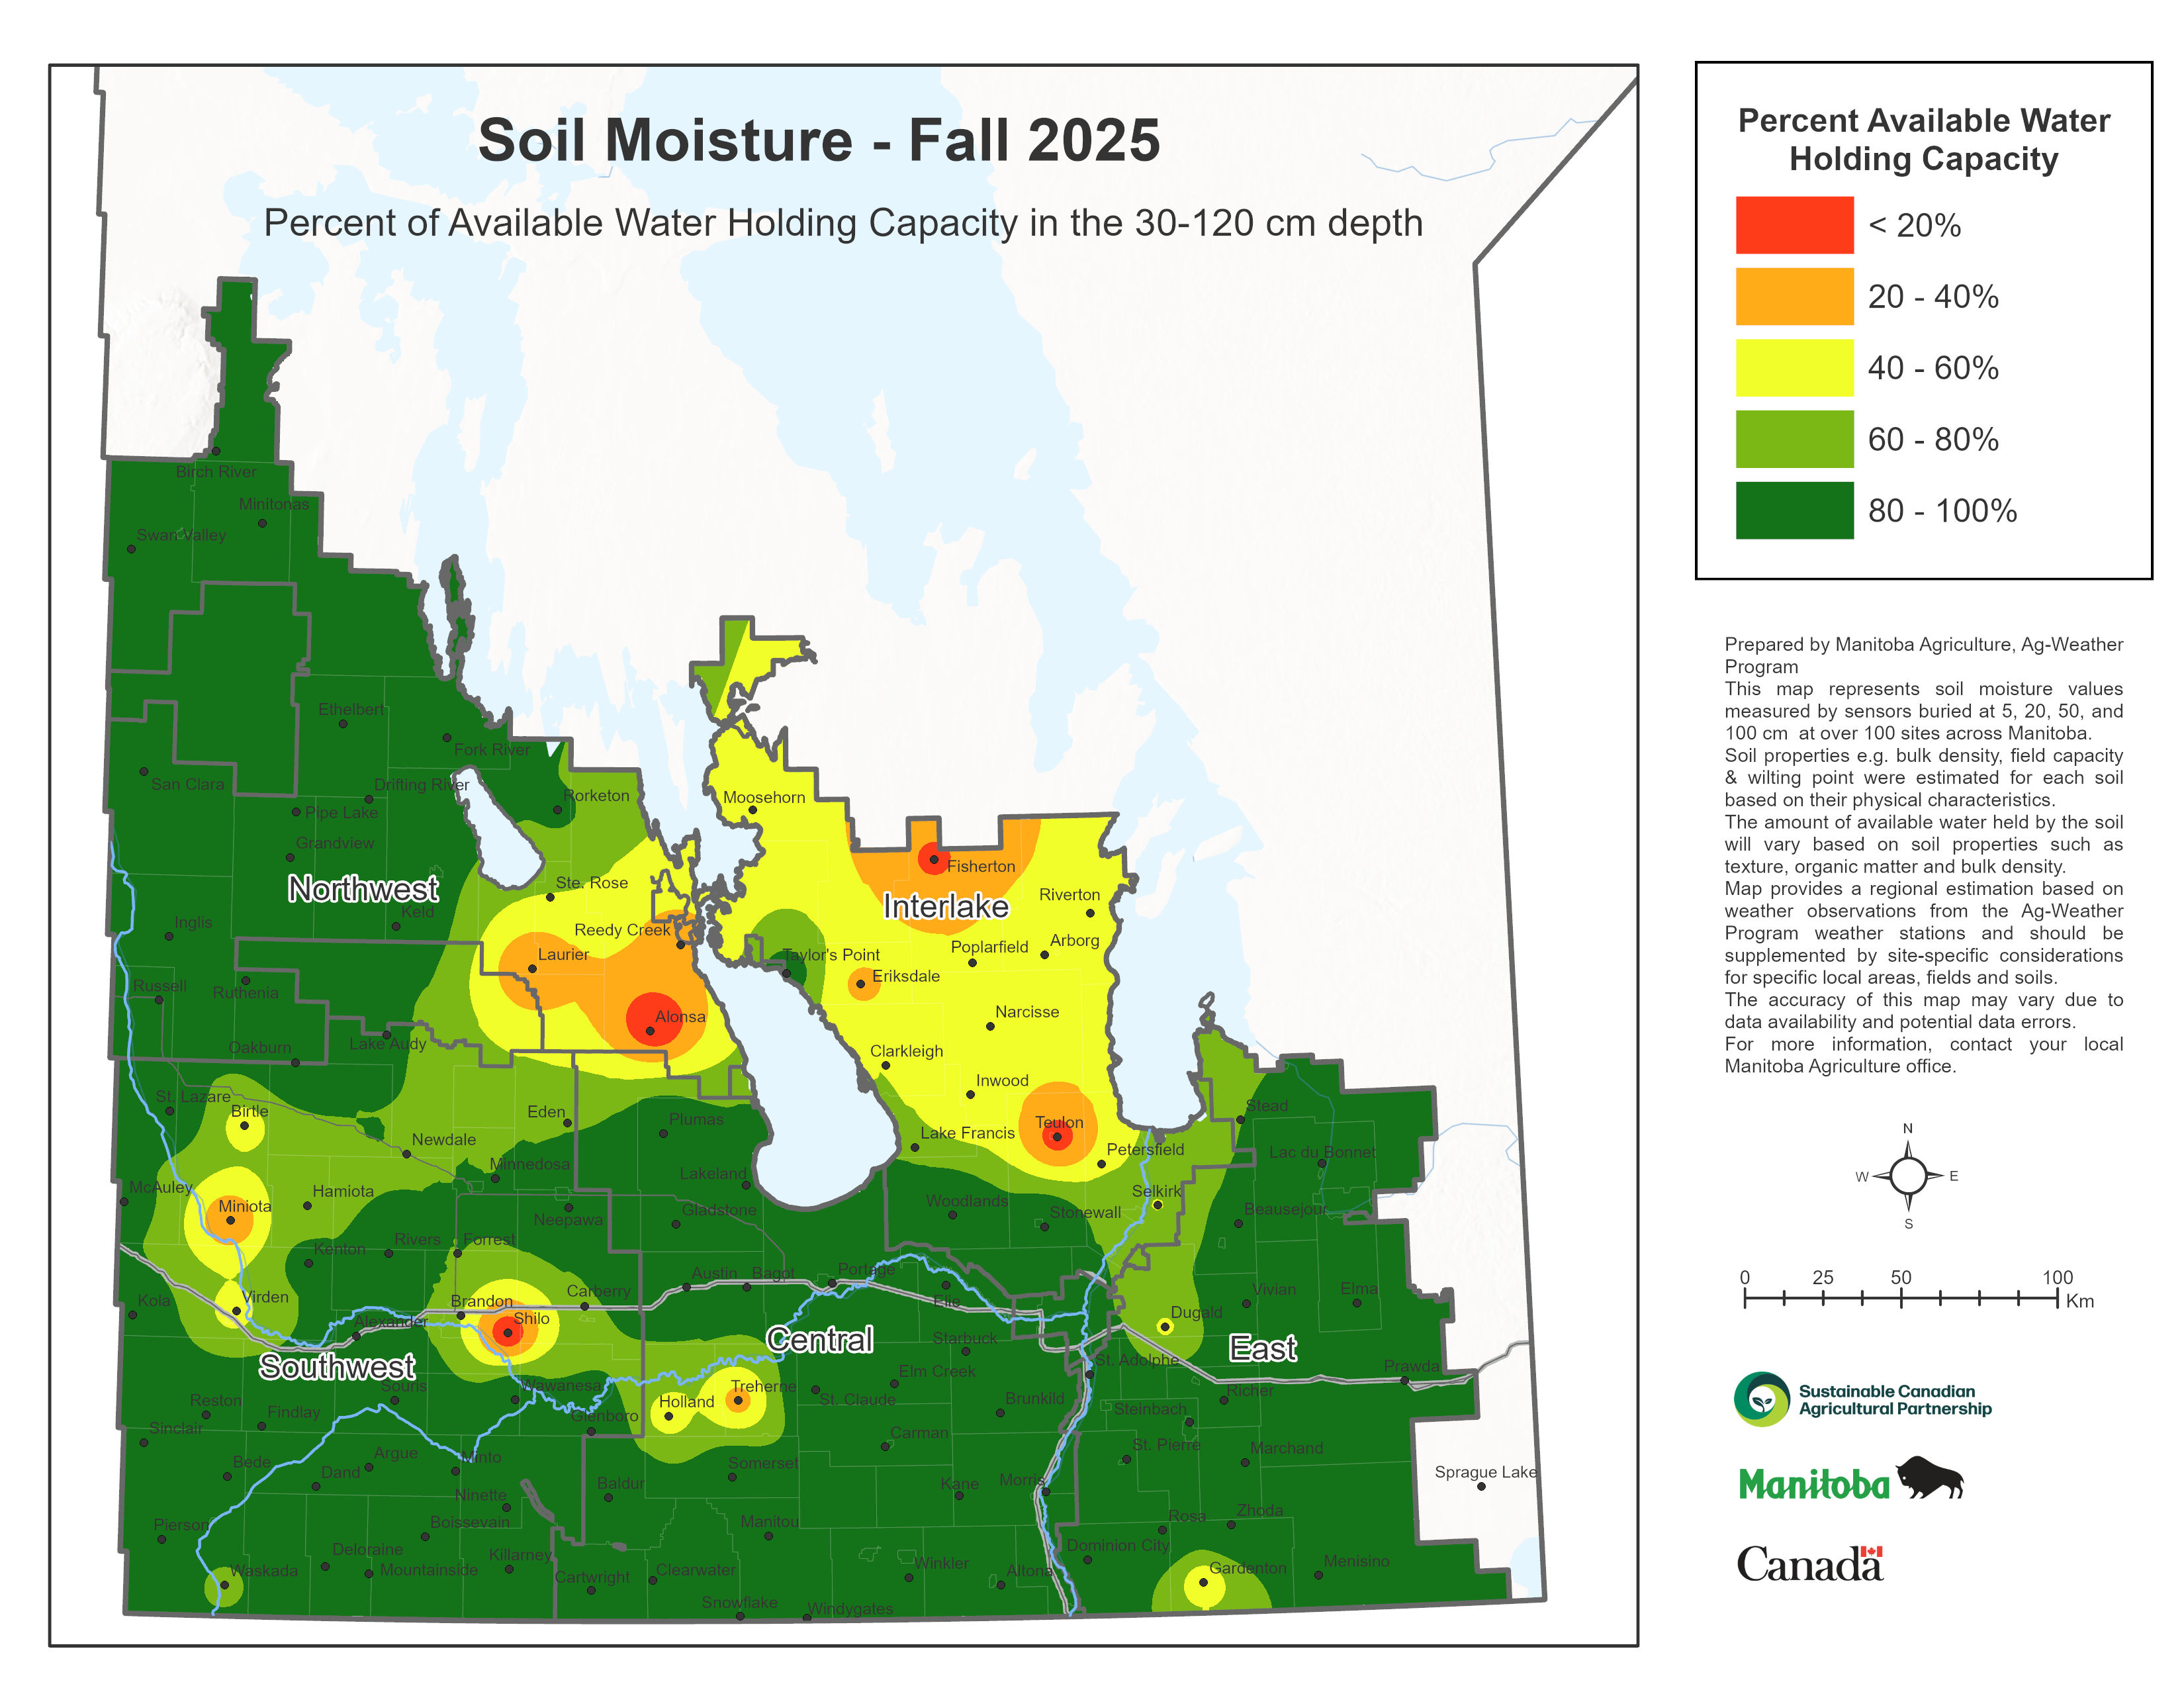
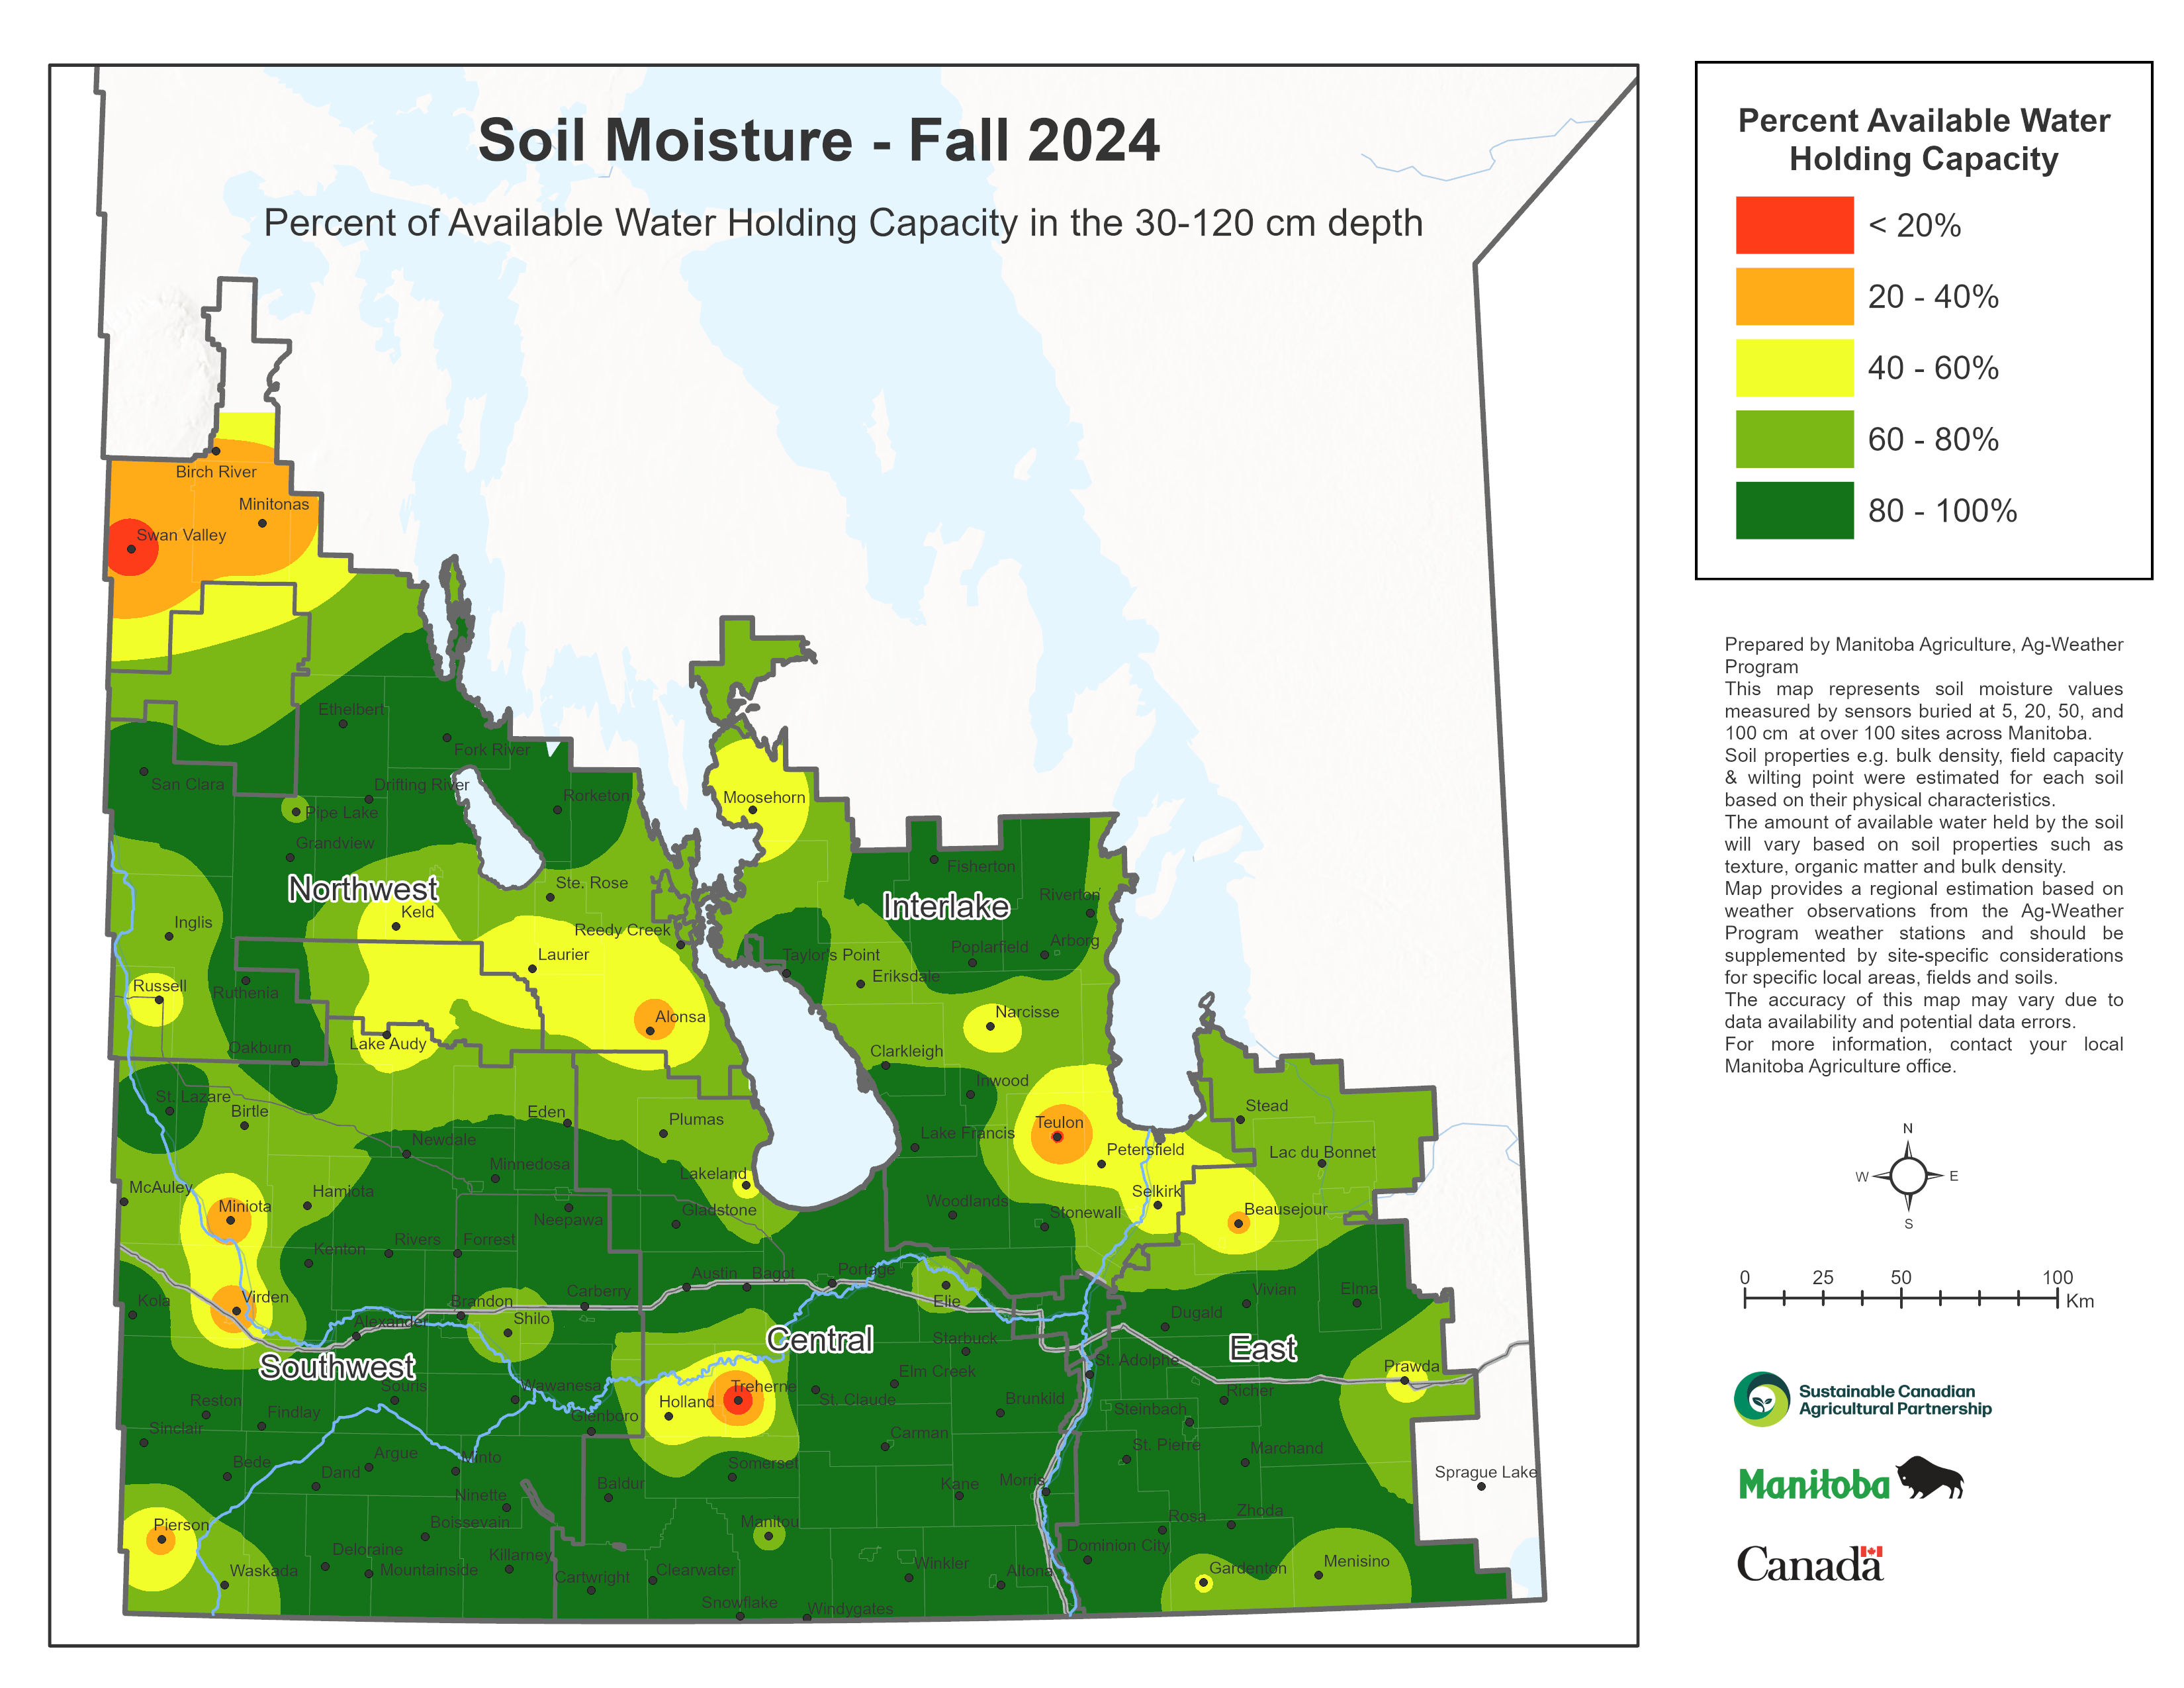
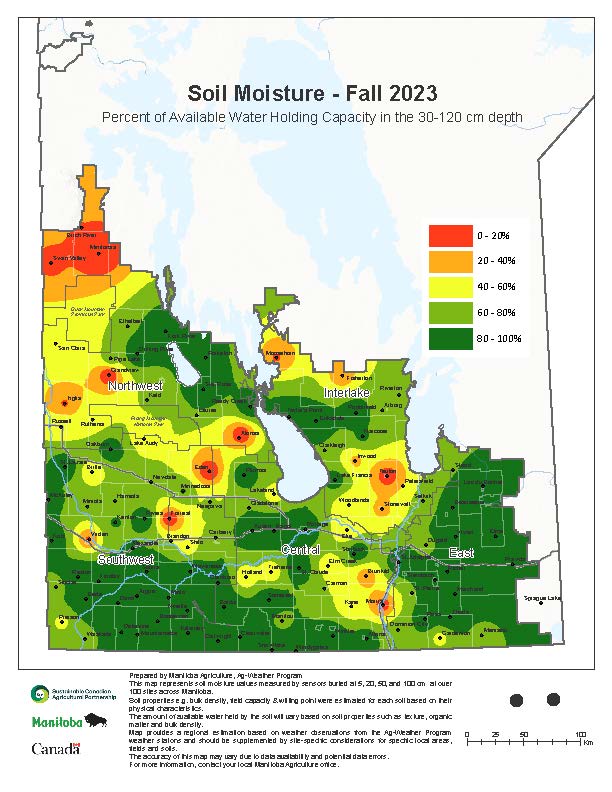
Starting in 2016, ML3 Theta-probe sensors were installed at 5, 20, 50 and 100 cm depths at about 107 weather station locations within the agricultural region of the Province. The 2018 fall moisture survey was used as a baseline to compare ground sampling and data from sensors. The results were comparable and digital observations from the sensors were used to make the fall soil moisture maps from 2019 and onward.
Sensors installed at 5, 20, 50 and 100 cm depths were used to represent soil moisture at 0-10, 11-30, 31-70, and 71-120 cm, respectively. The soil moisture sensor-monitored data at freeze-up are noticeable due to the sharp drop in the soil moisture value once the moisture in the soil turns to ice. The permittivity difference between water (about 80) and ice (about 3) drive the drop in the soil moisture value when the change in state occures. The sensor voltages are related to the dielectric permittivity of the soil that is then converted to soil moisture. Soil samples were taken at each location and depth for textural analysis, which were used to estimate field capacity, wilting point and the water holding capacity using pedo-transfer functions or classified based on similarities to well-characterized soils around Manitoba.
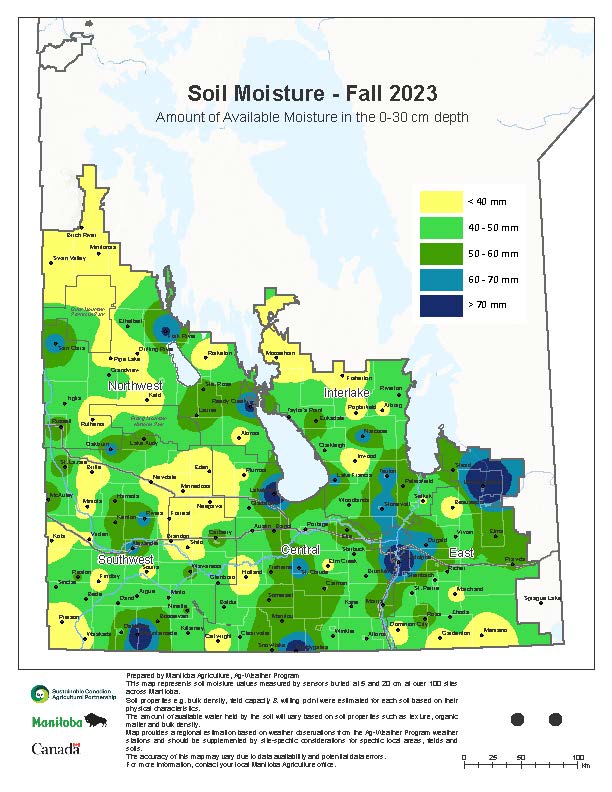
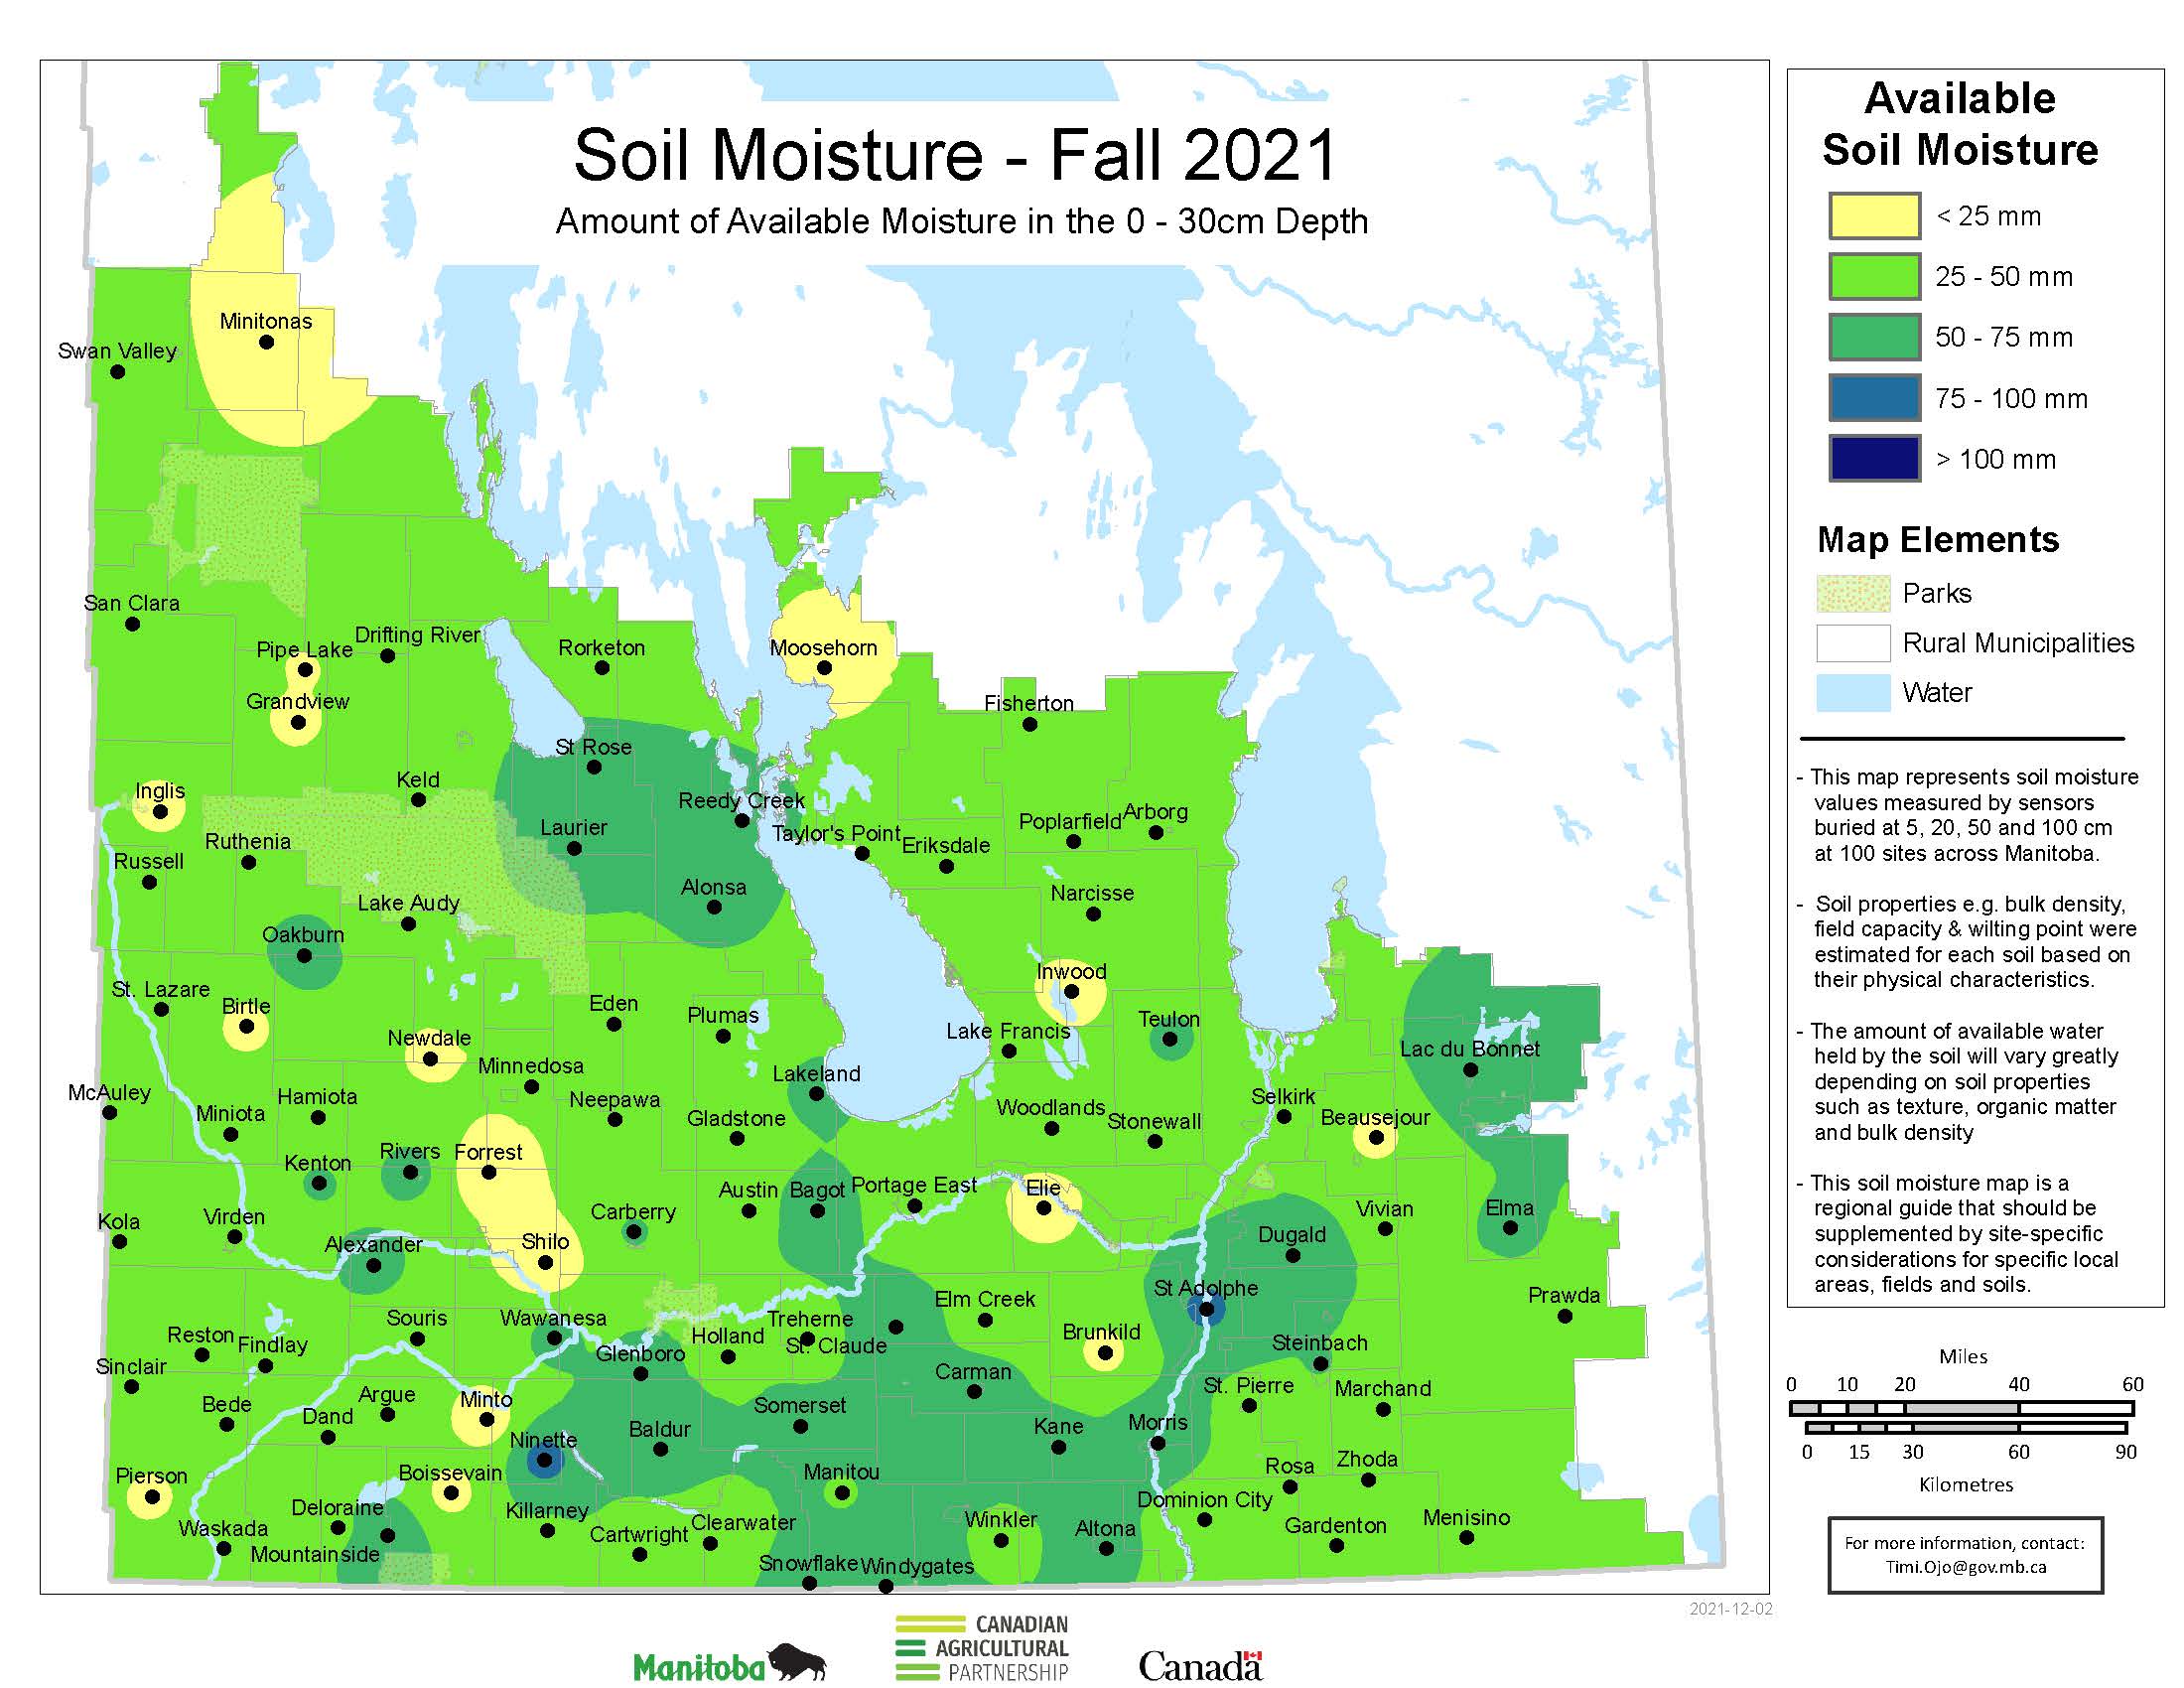
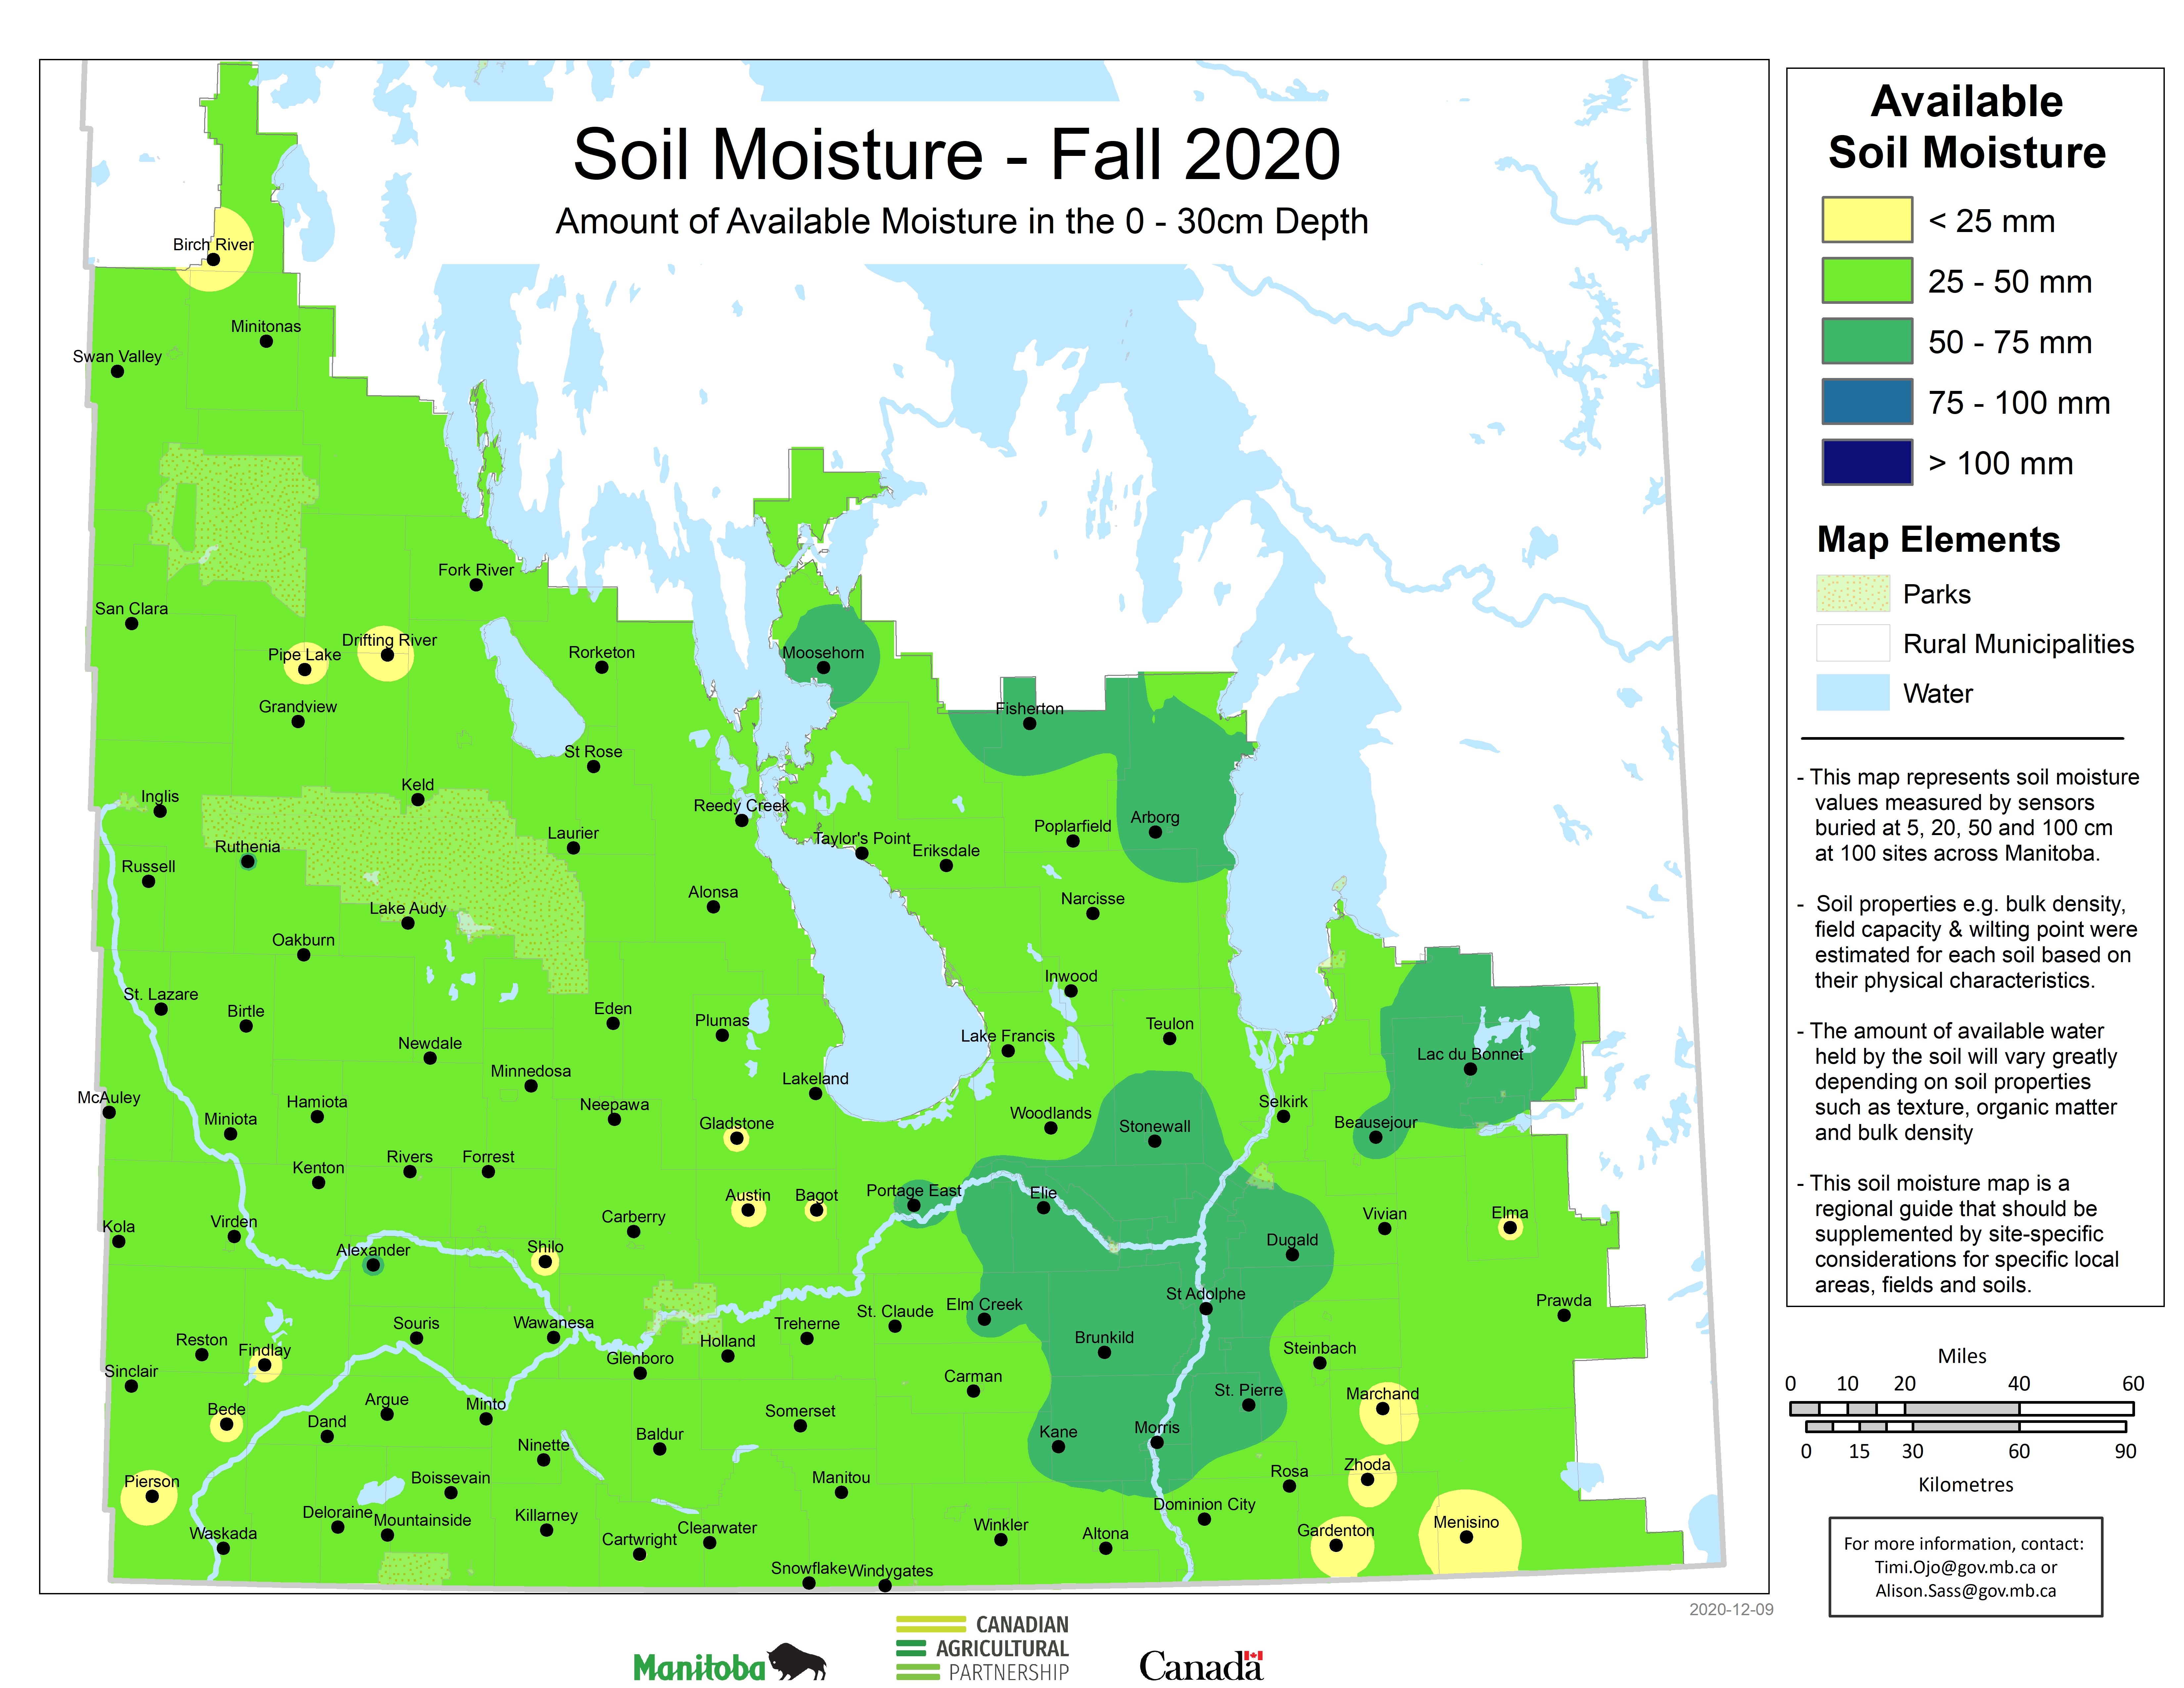
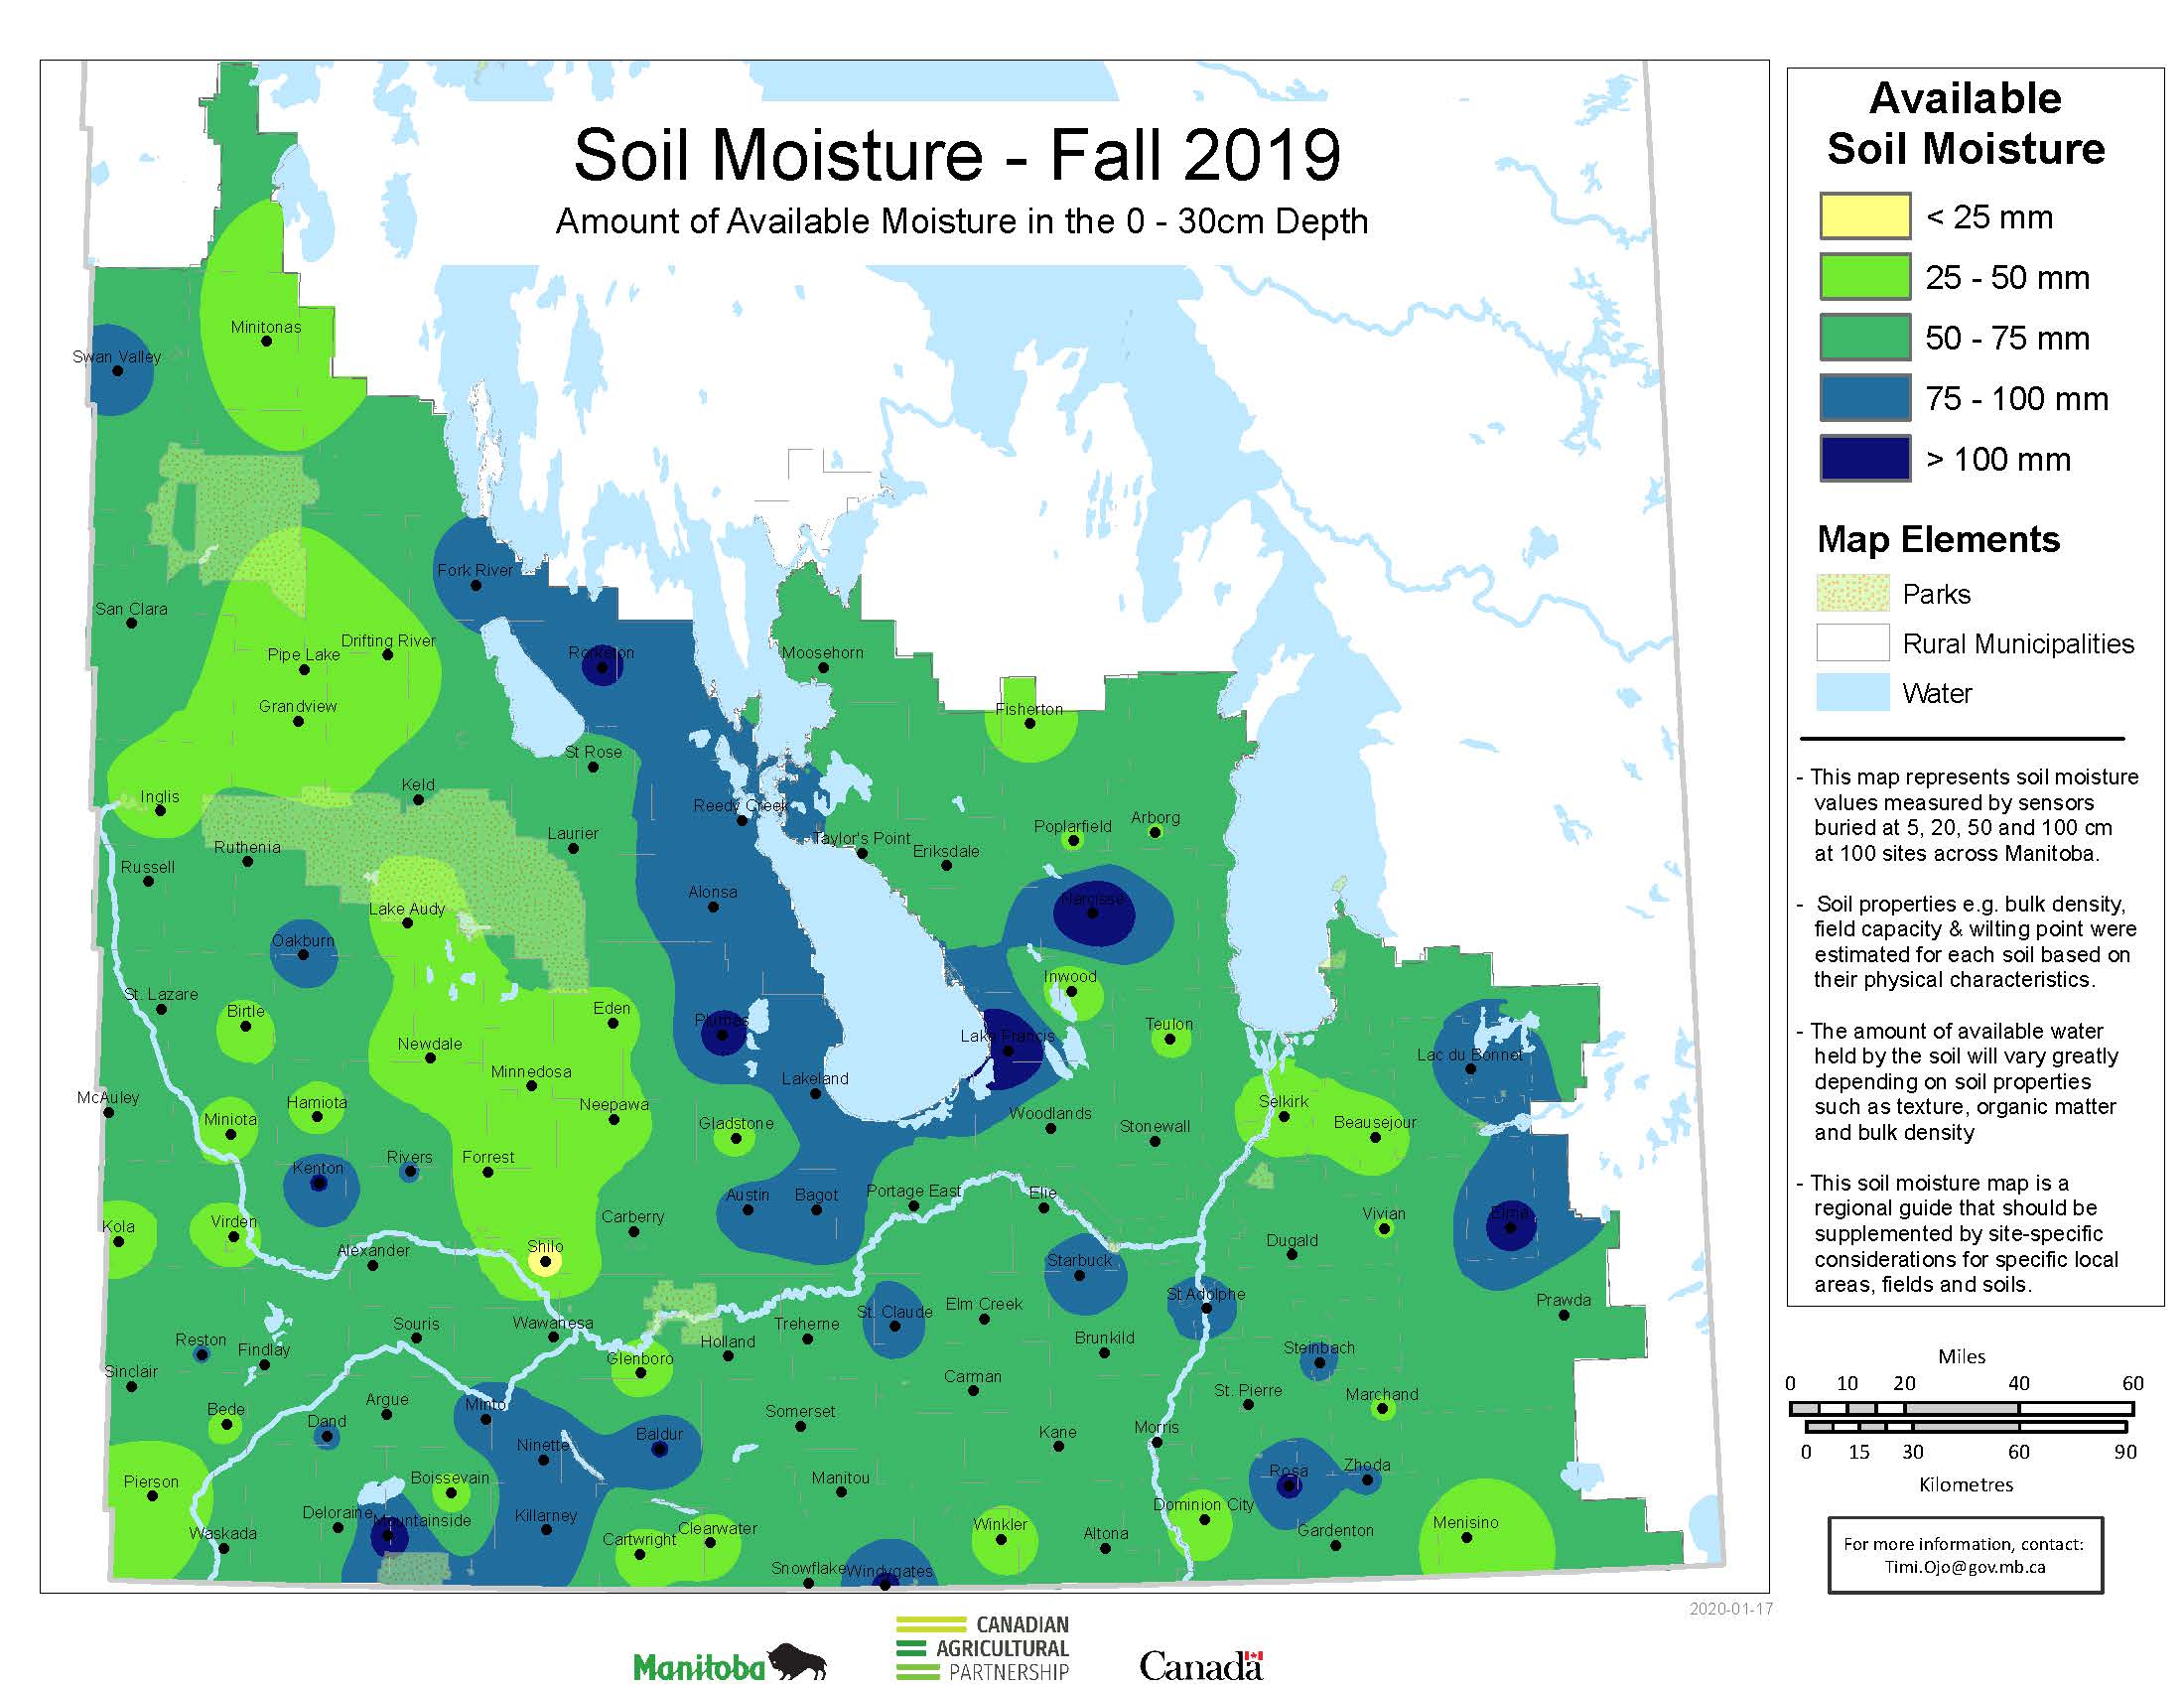
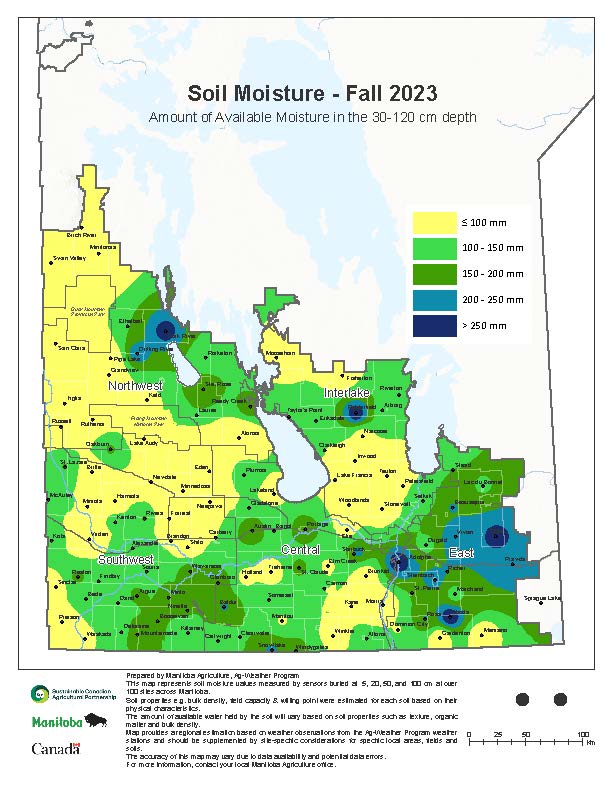
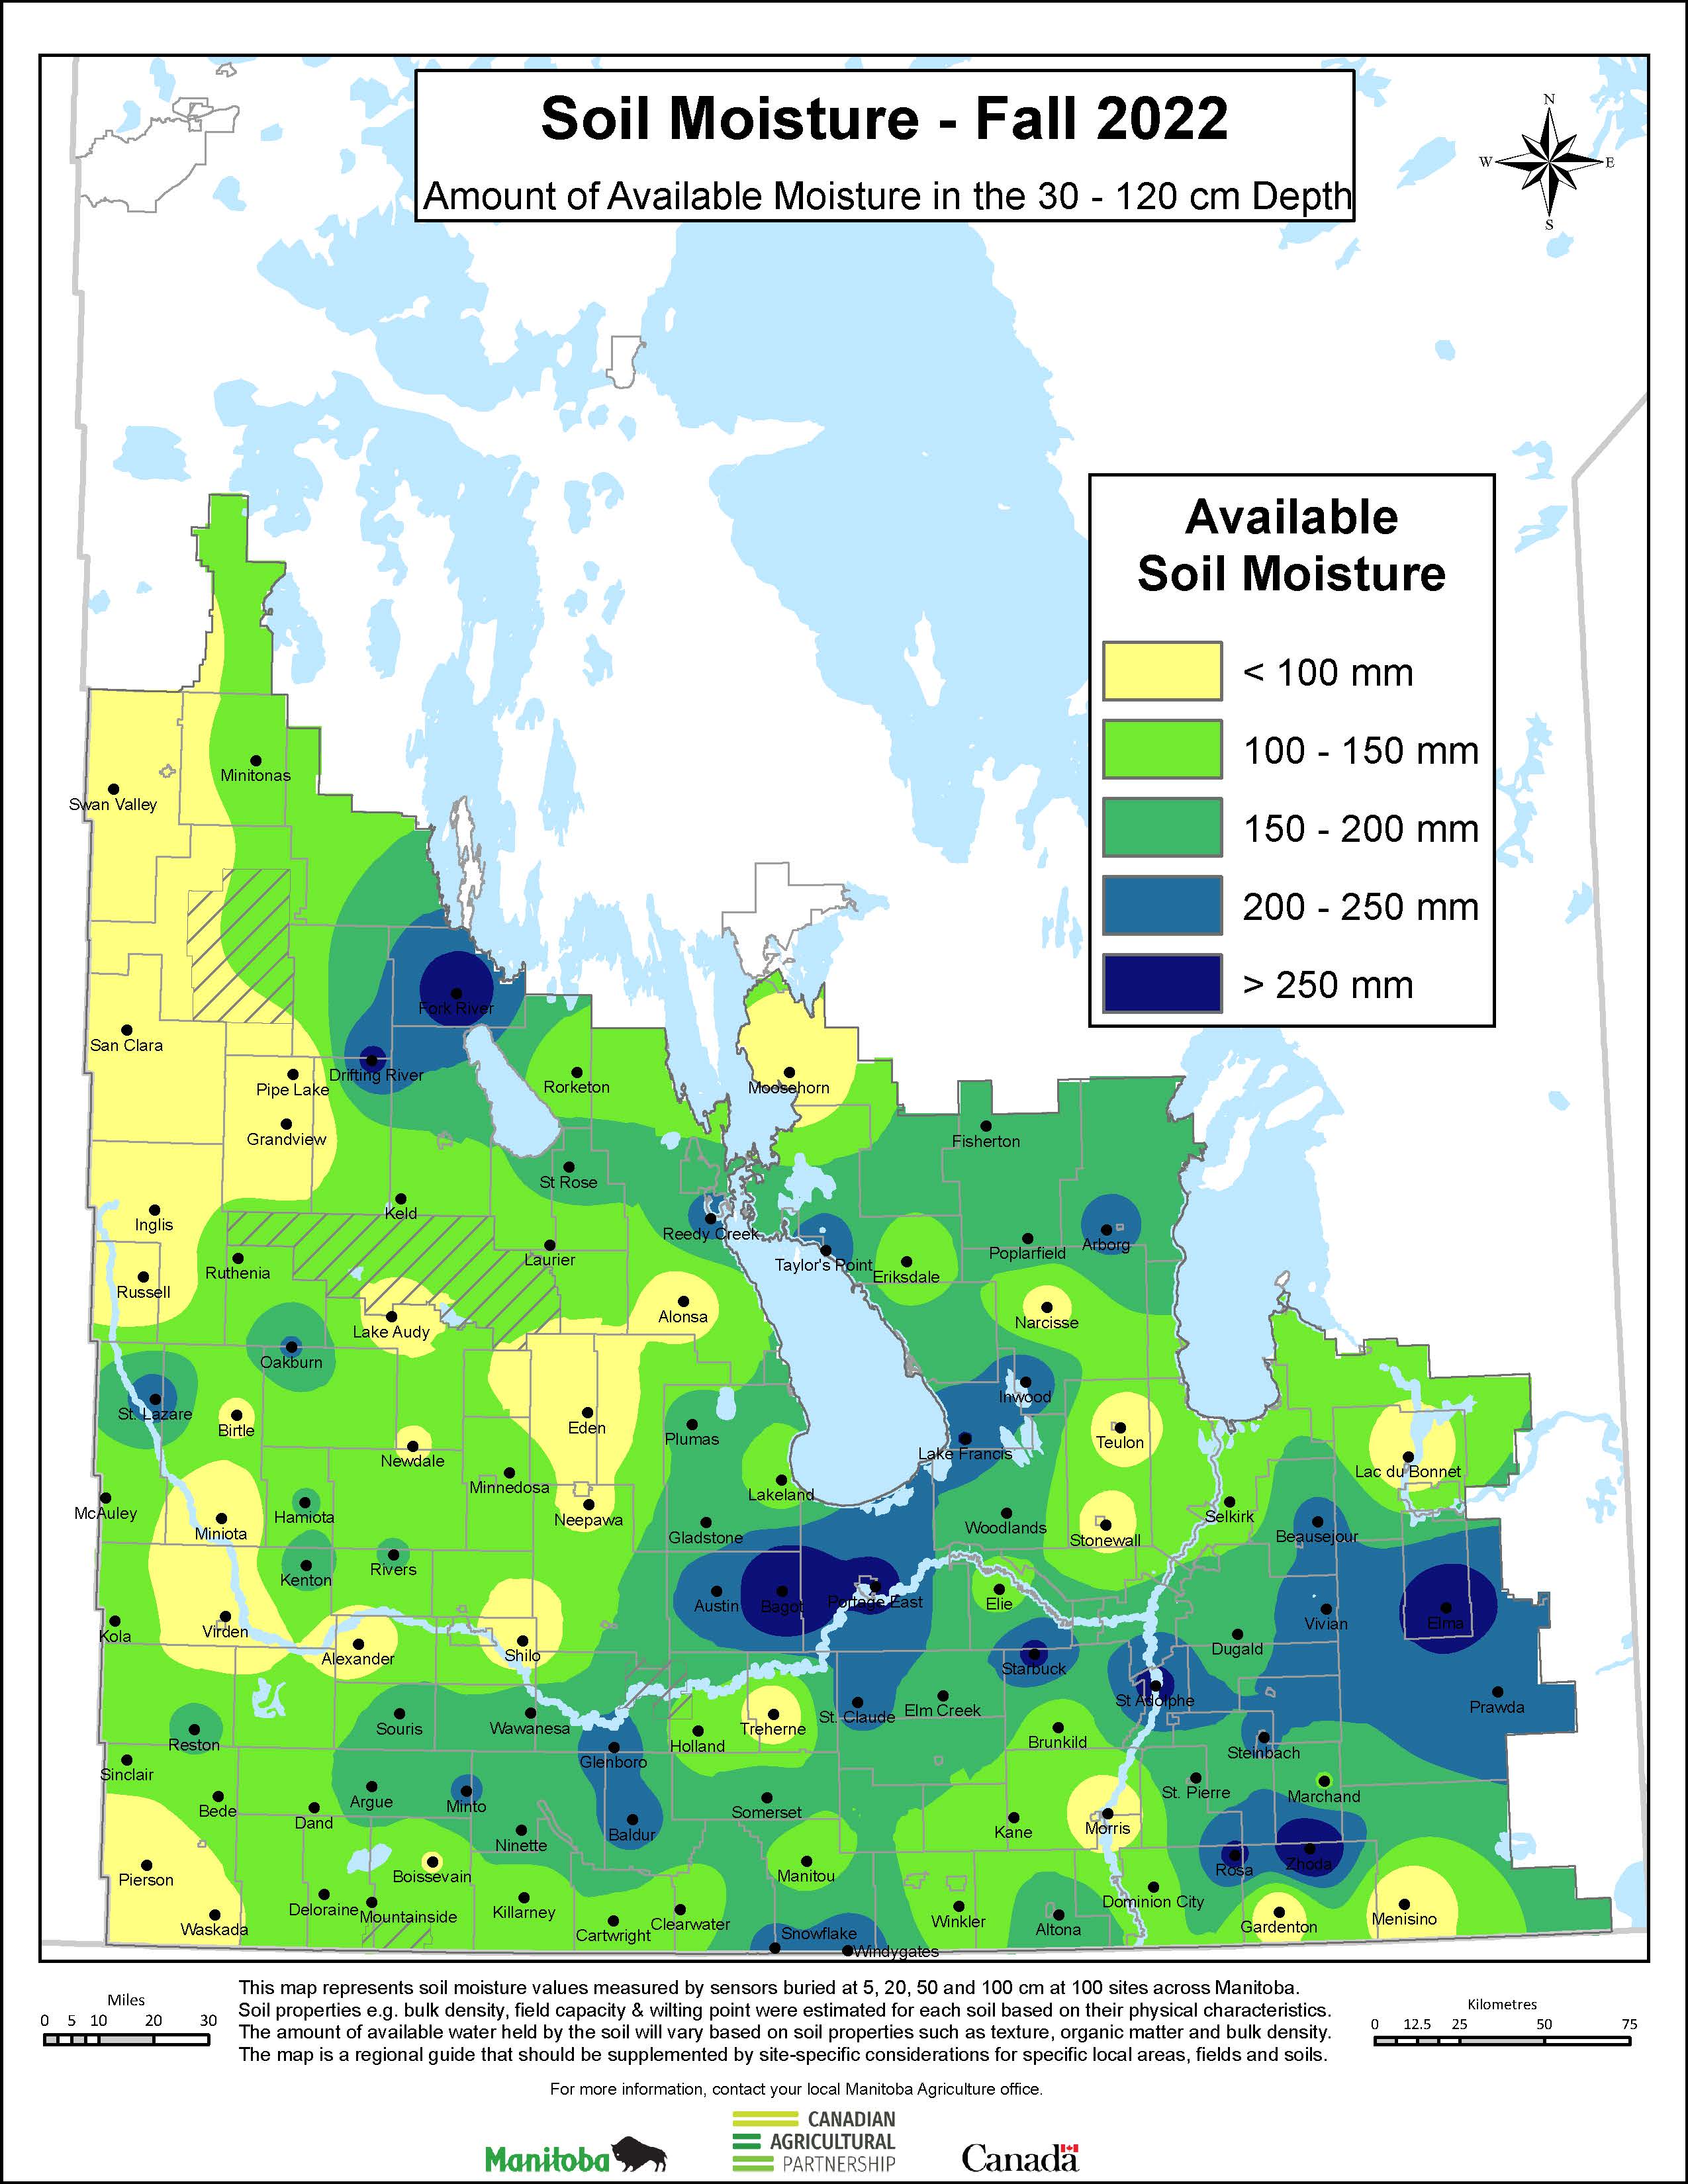
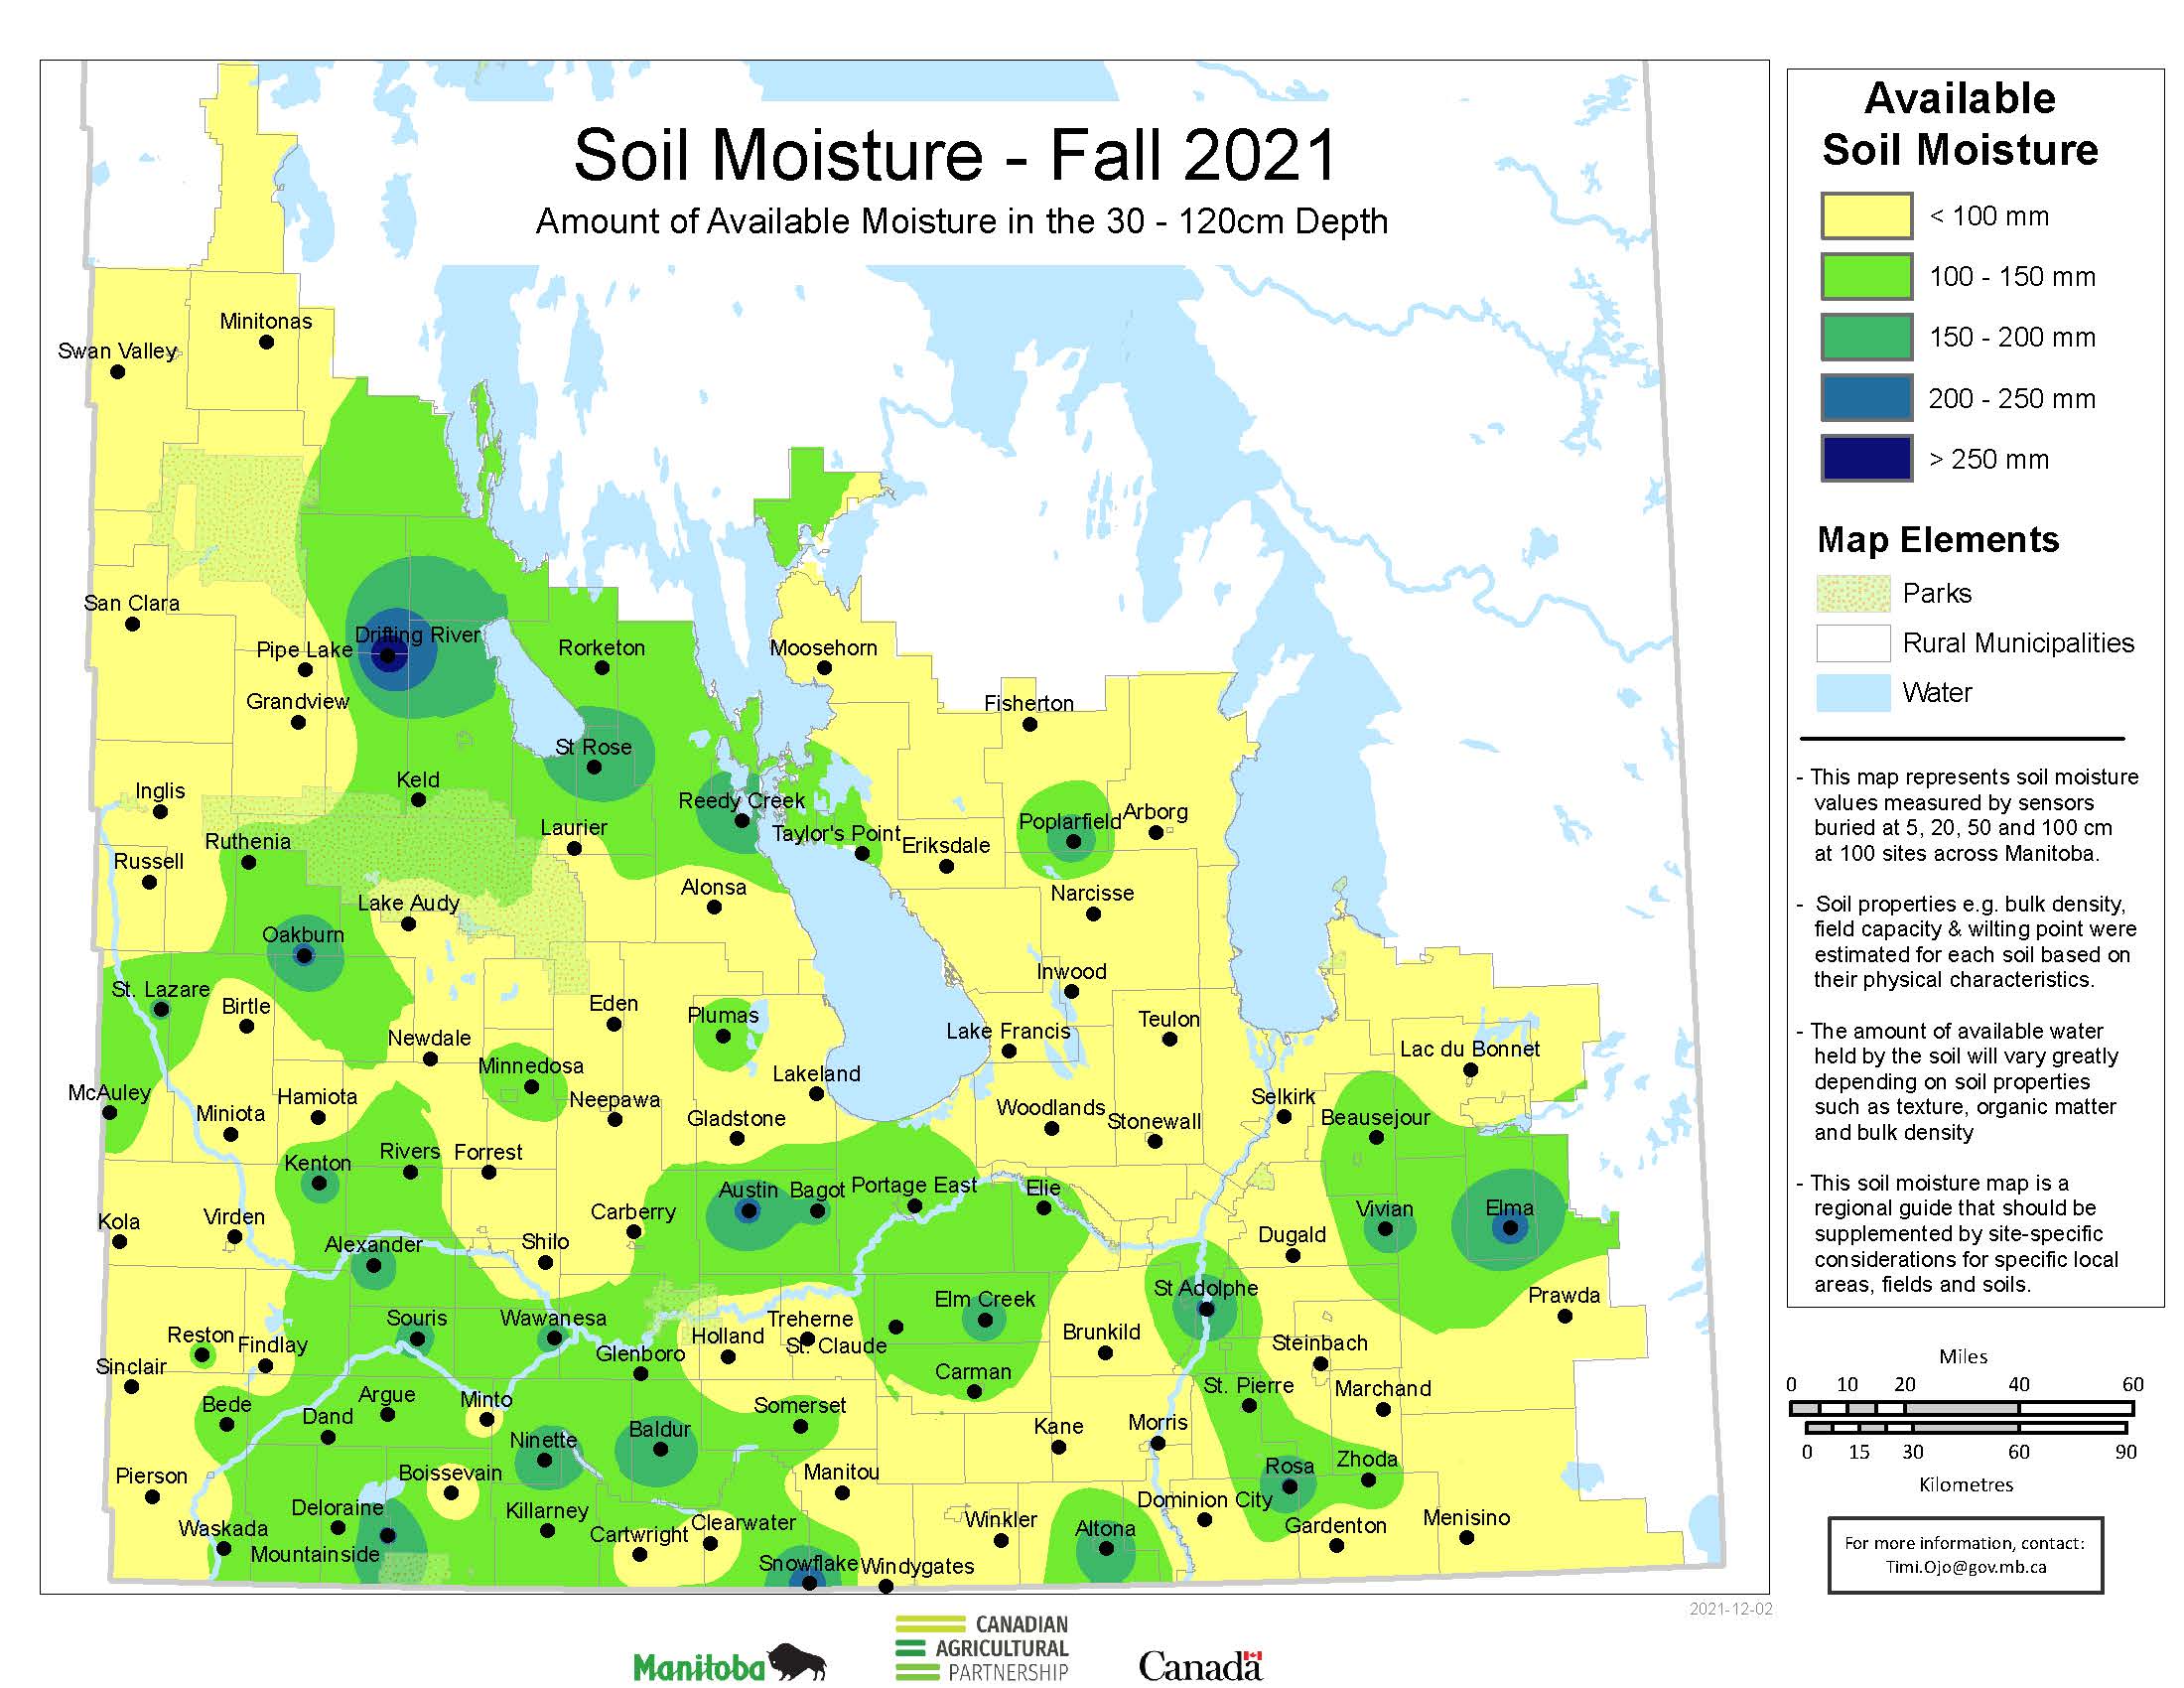
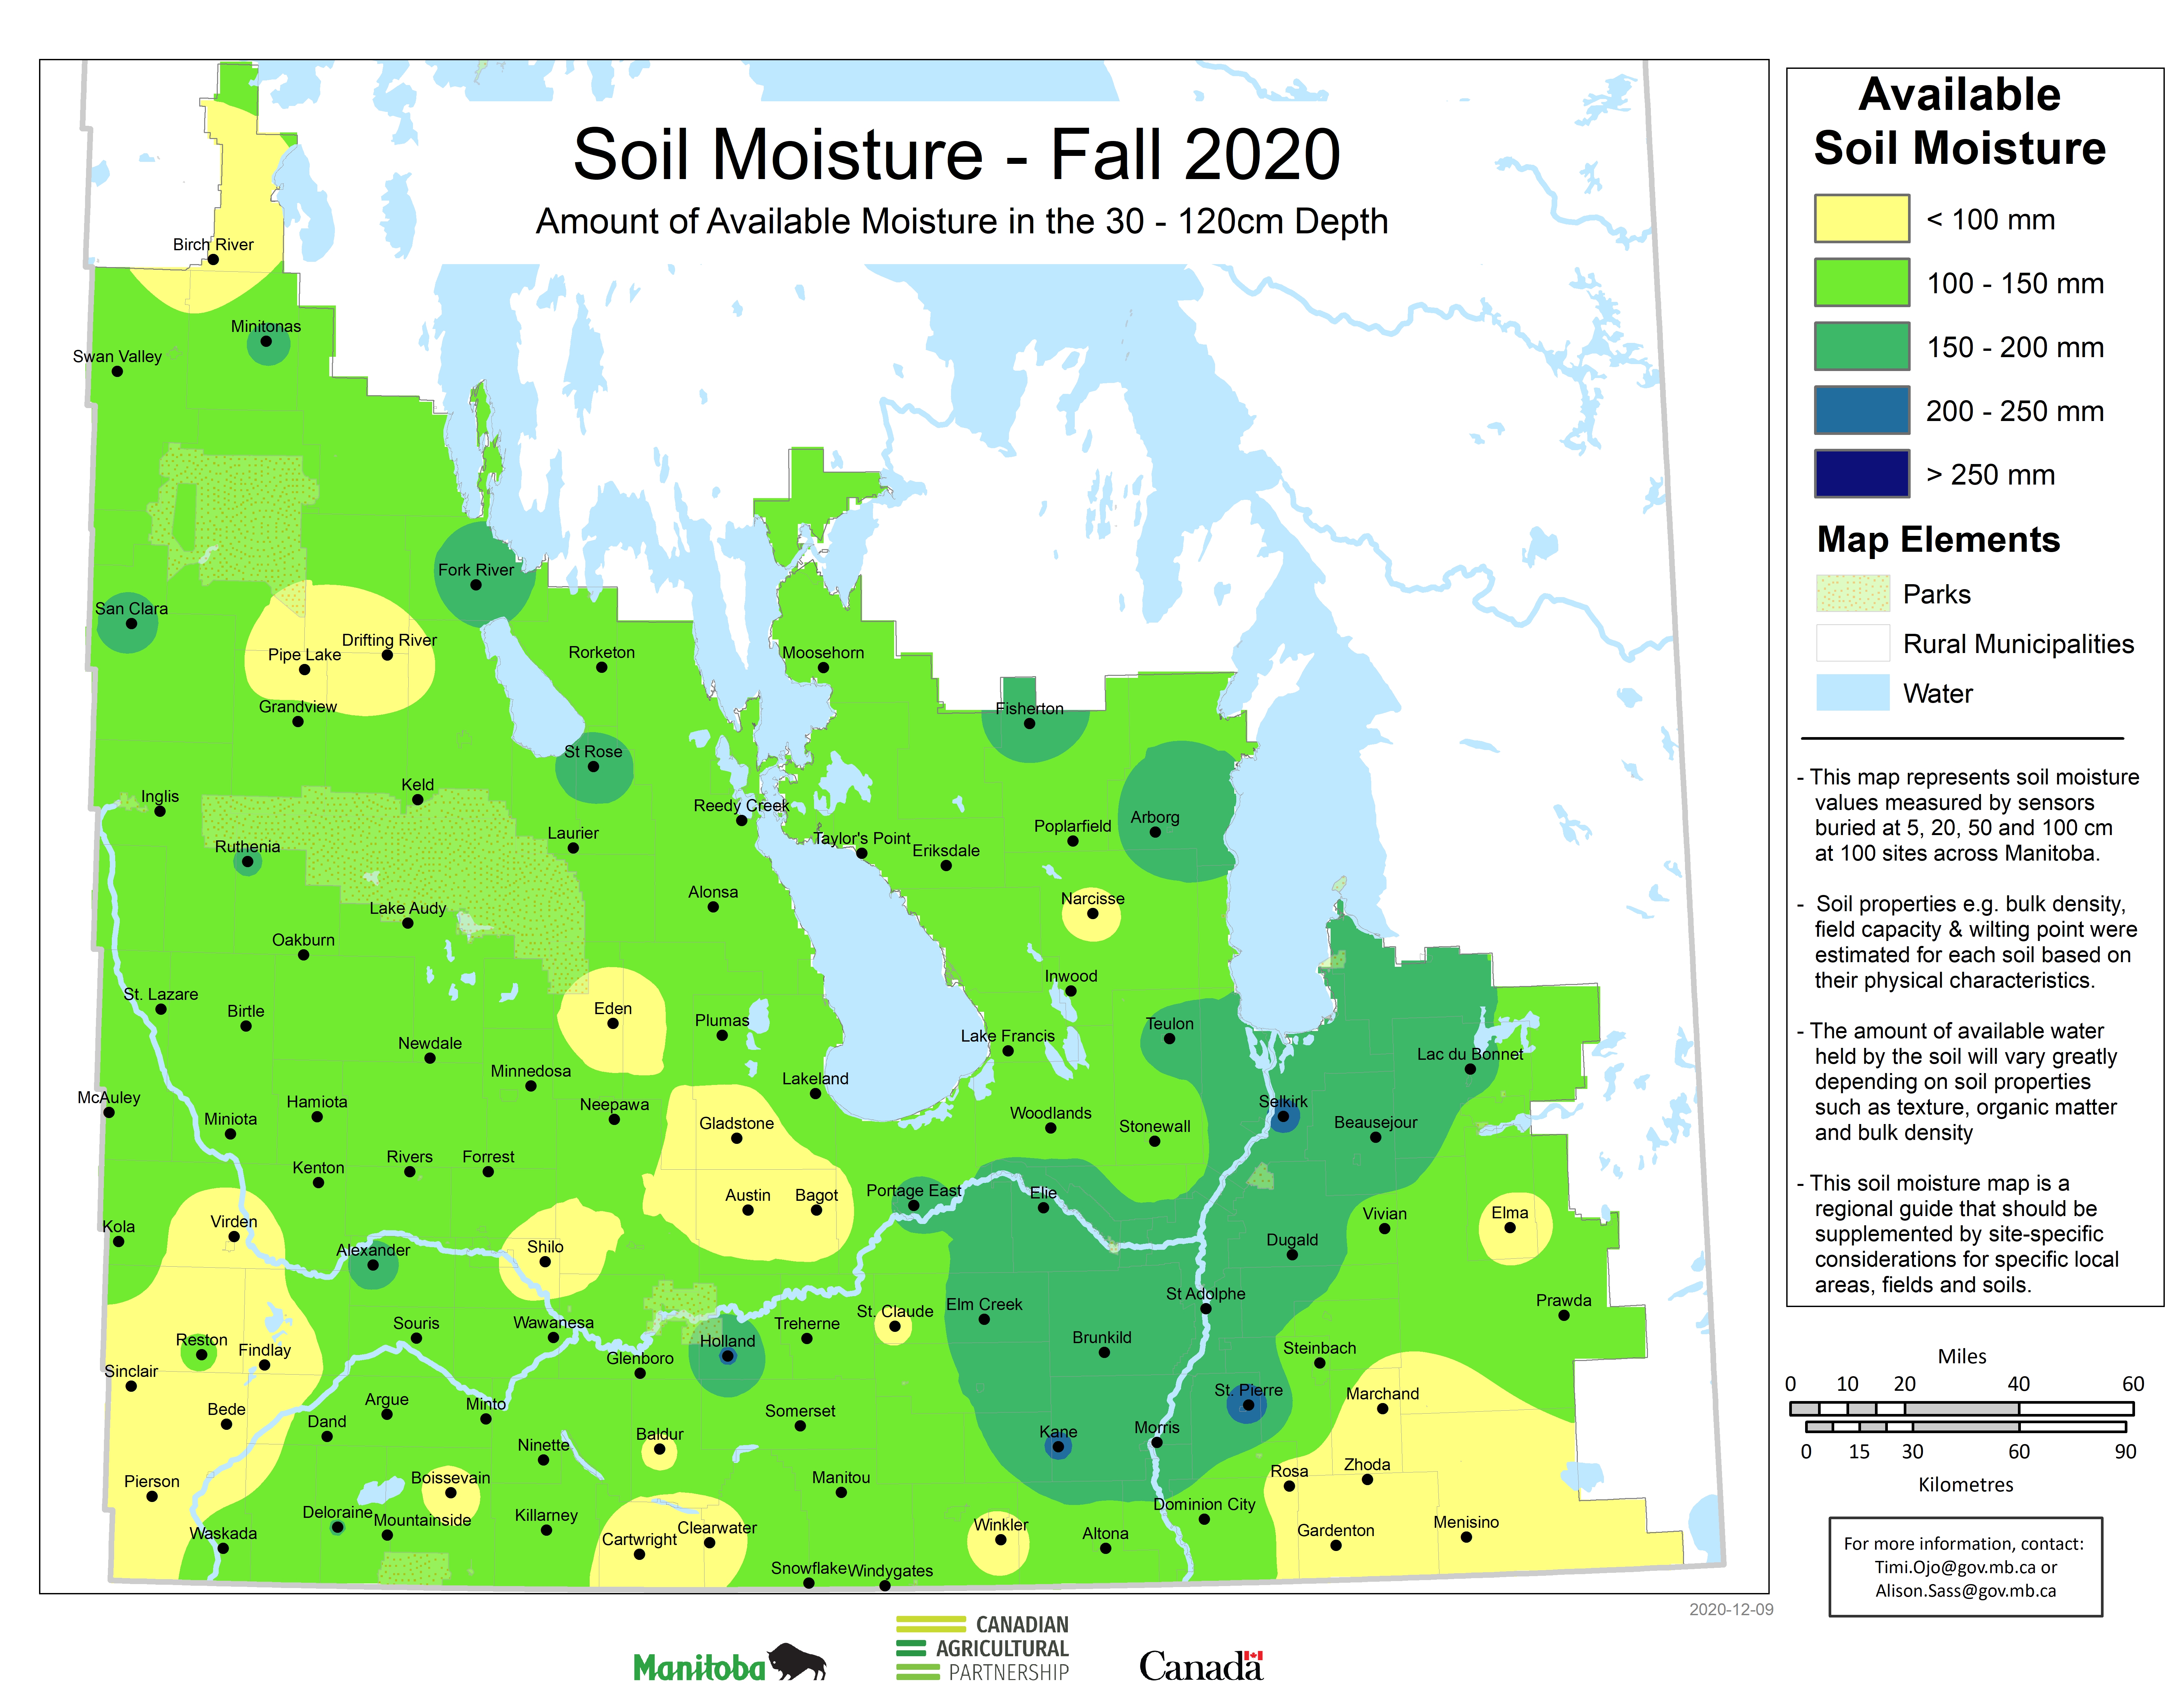
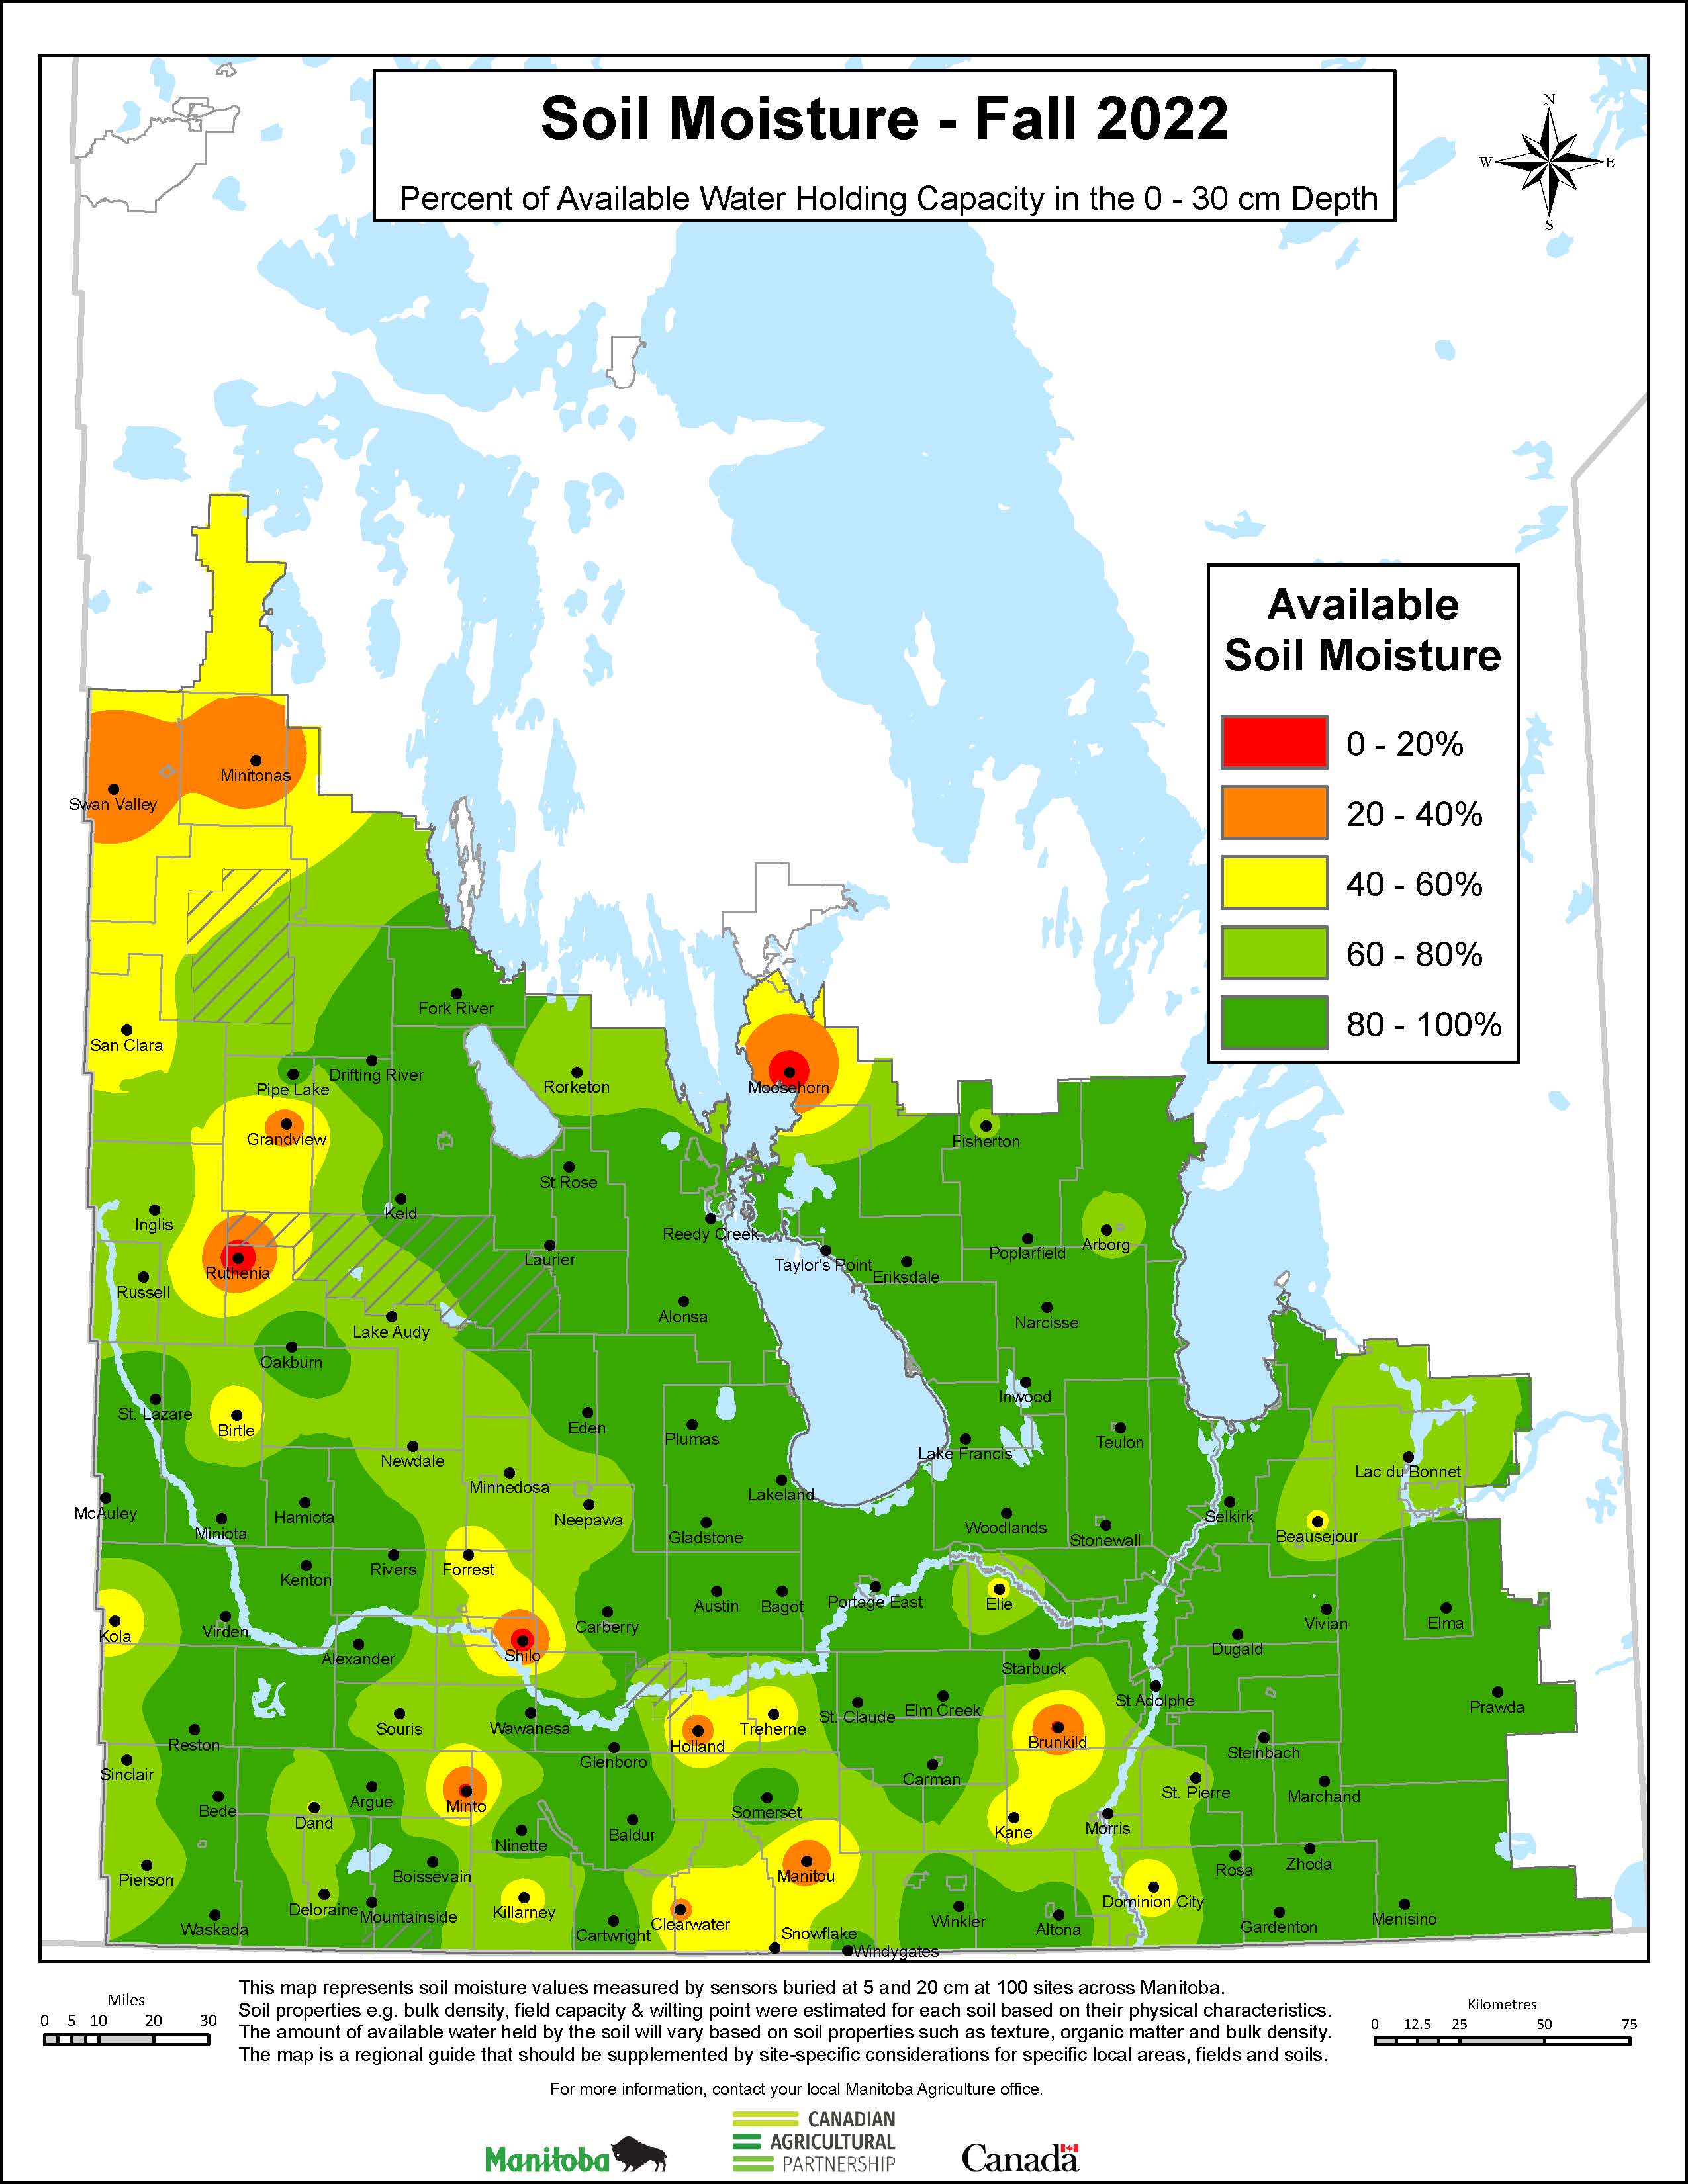
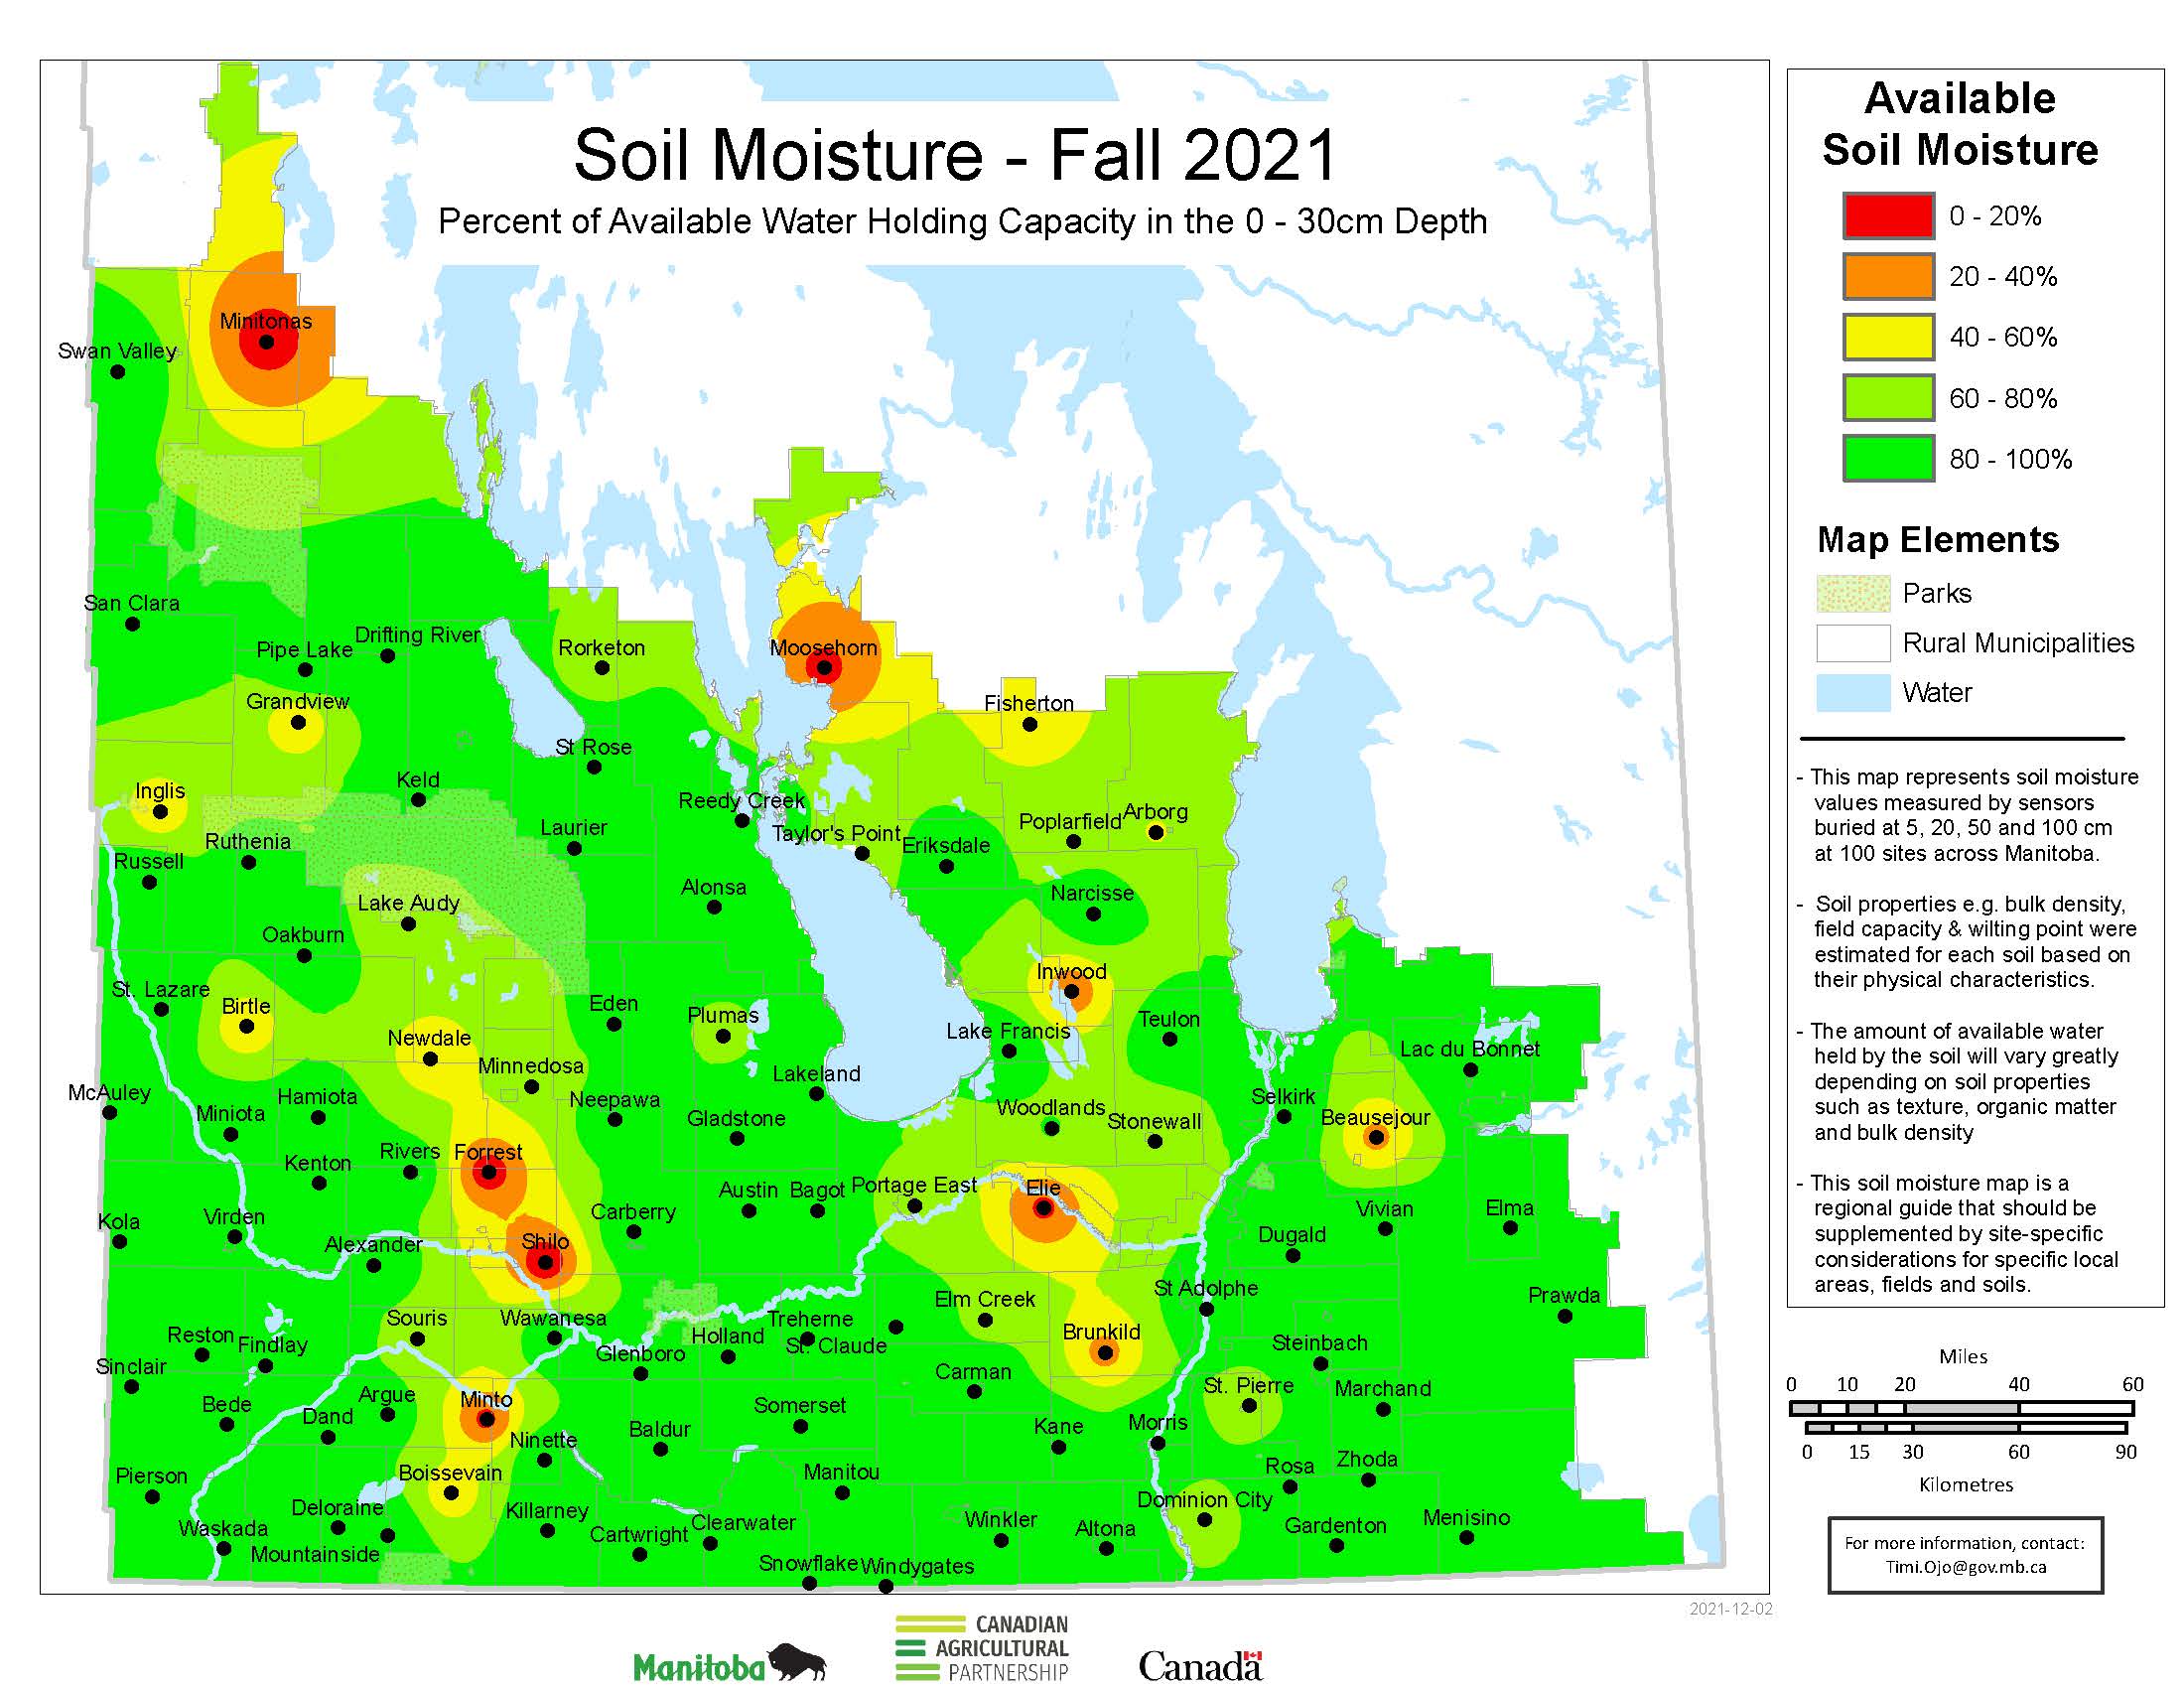
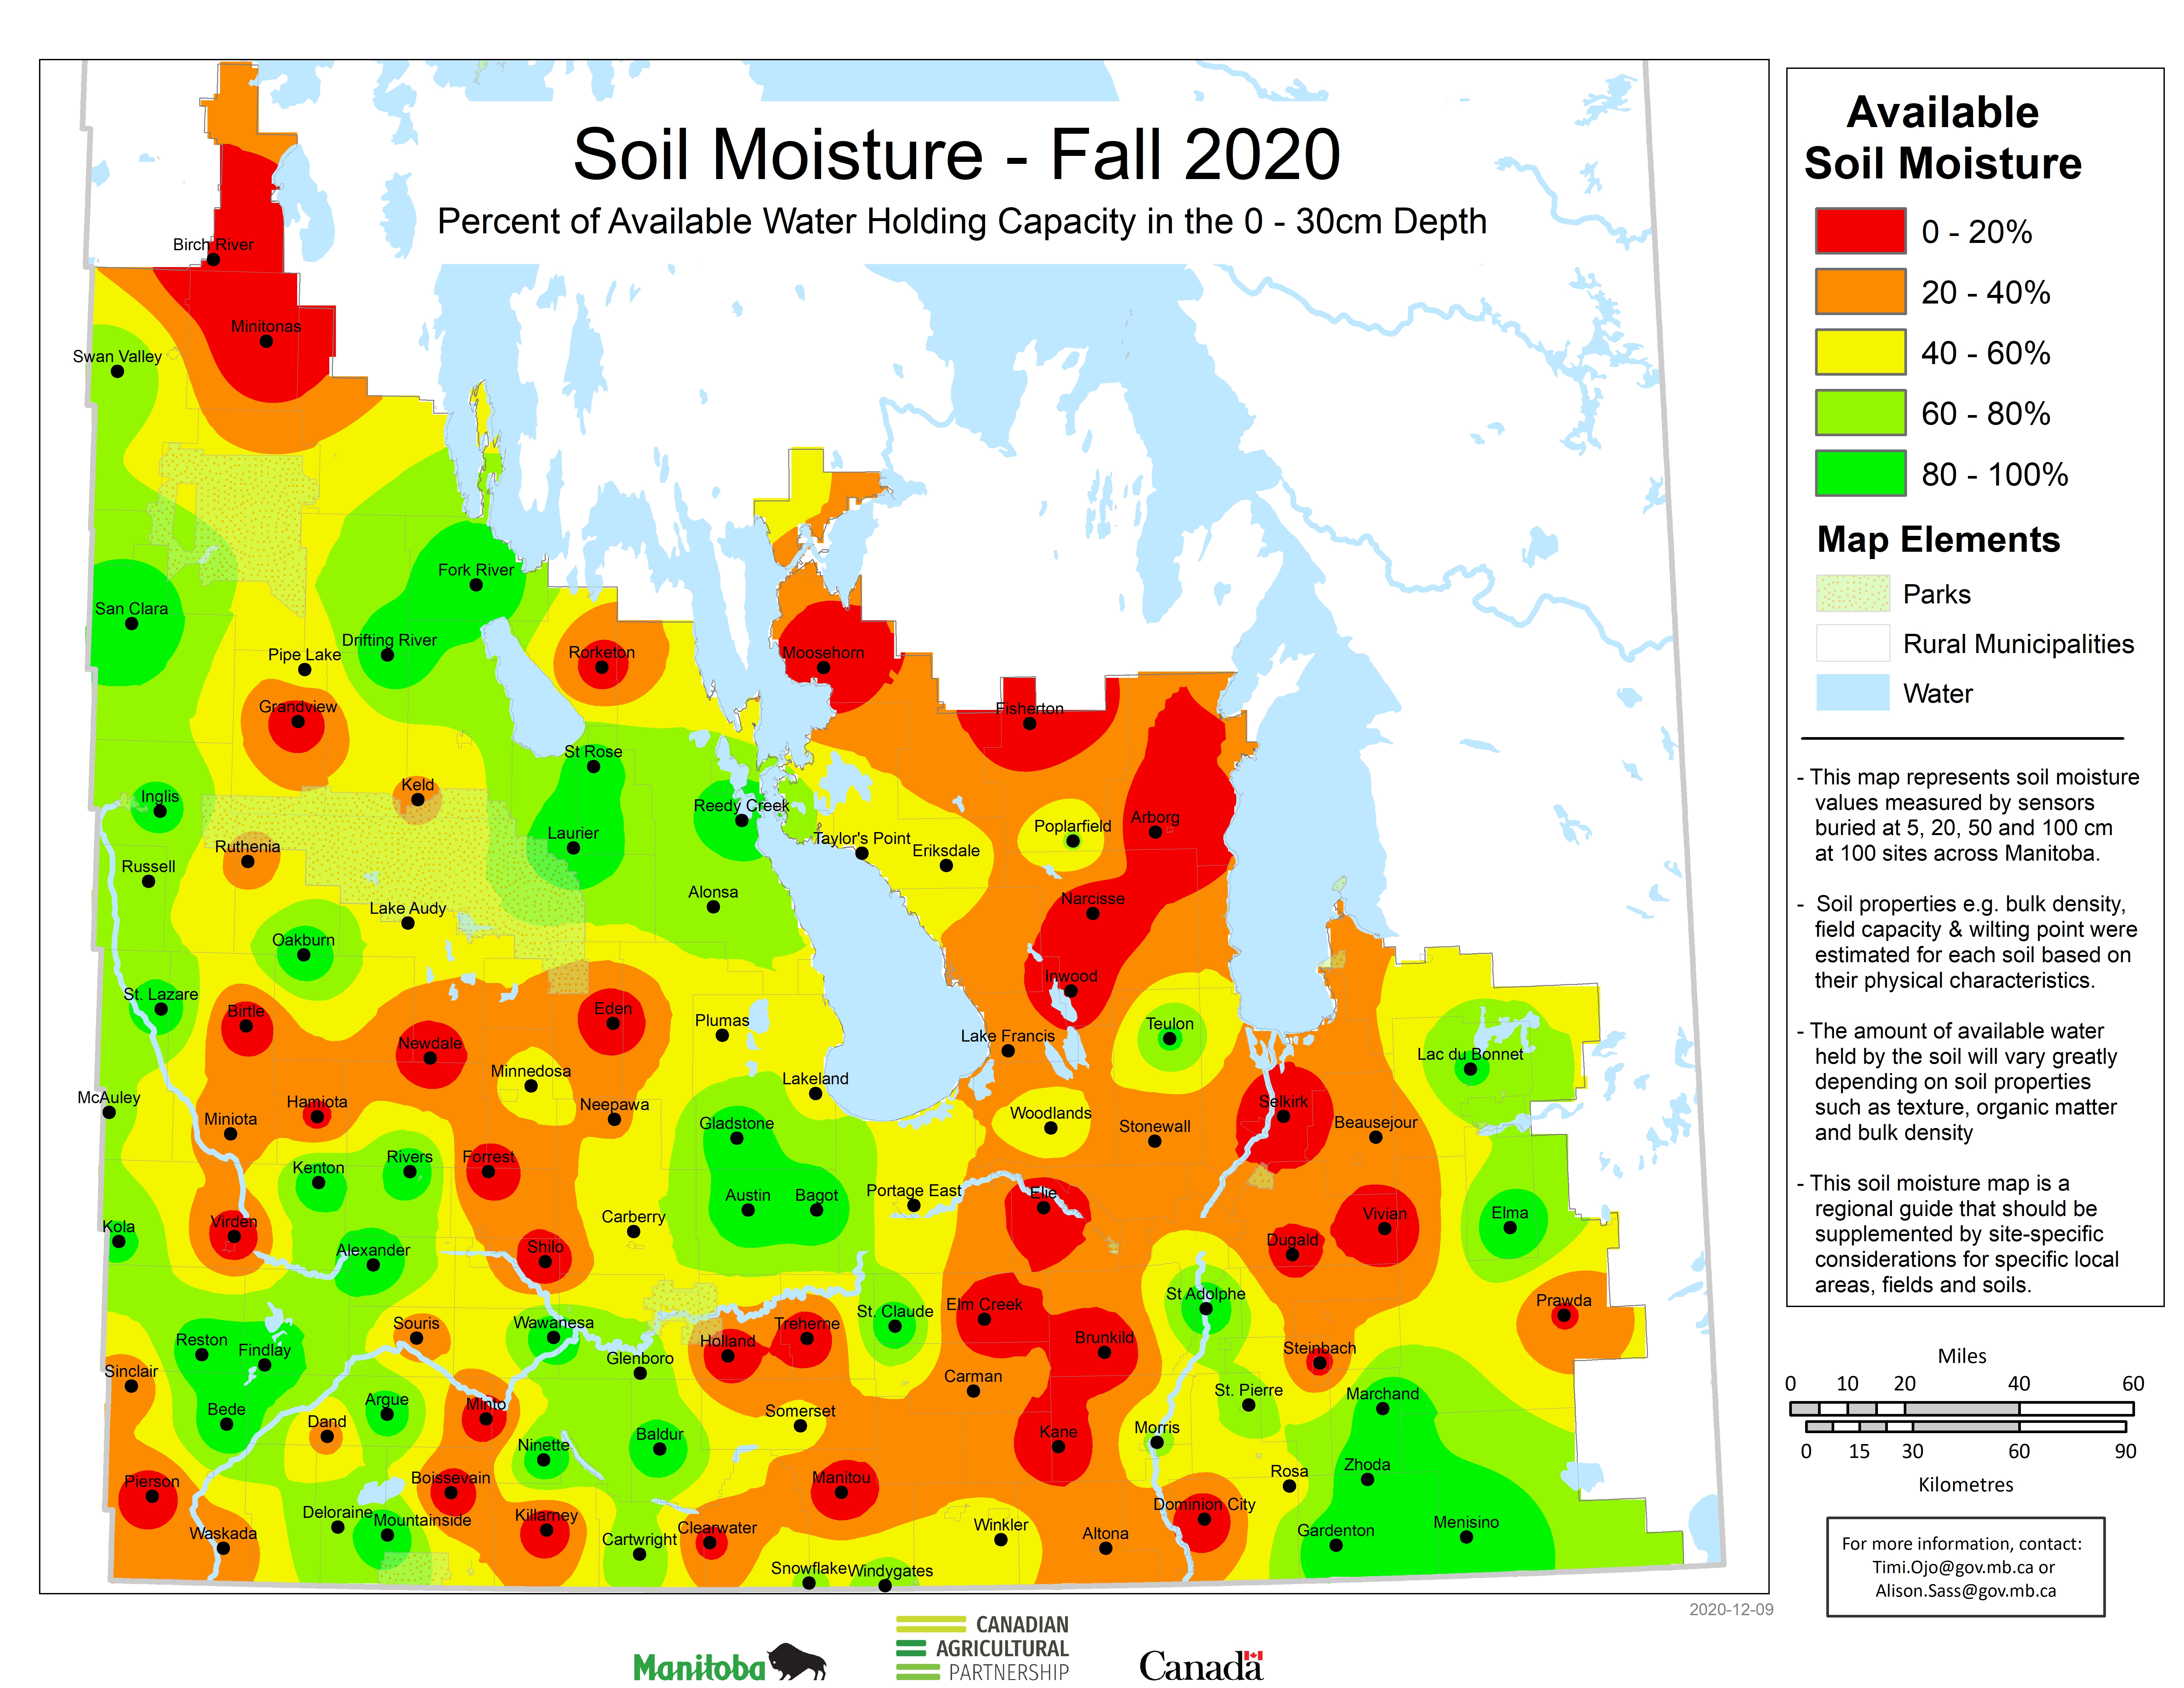
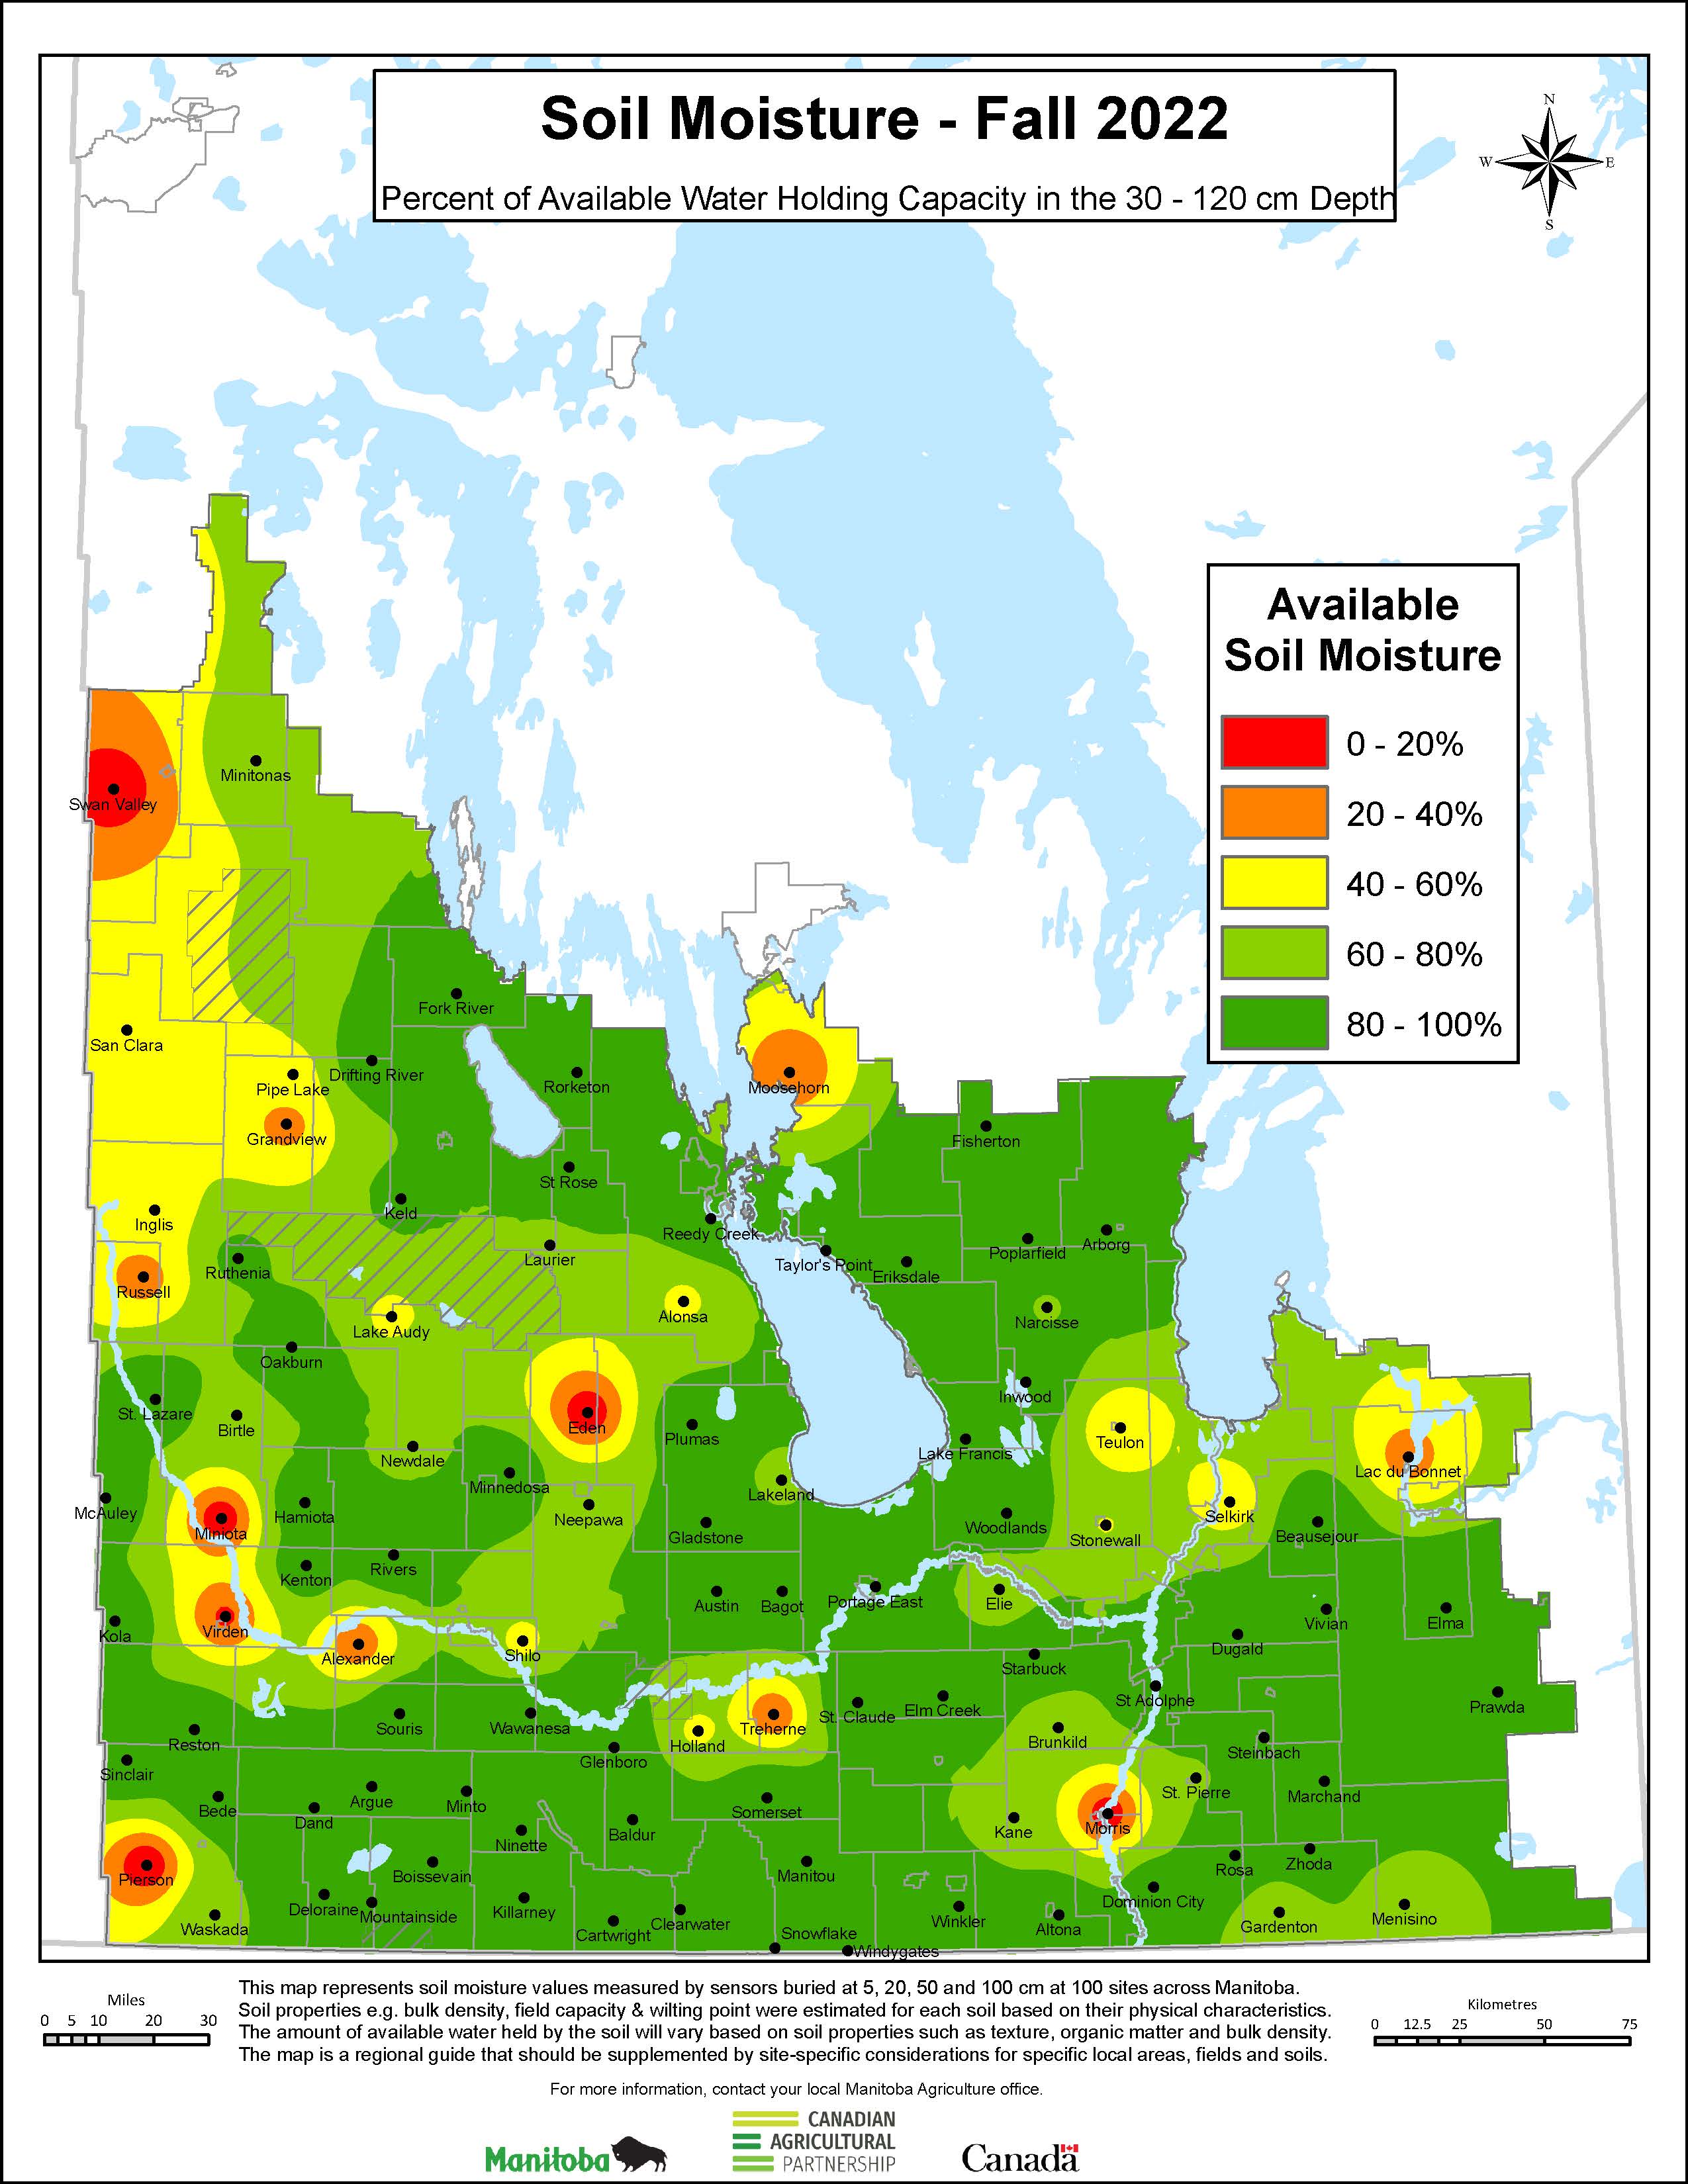
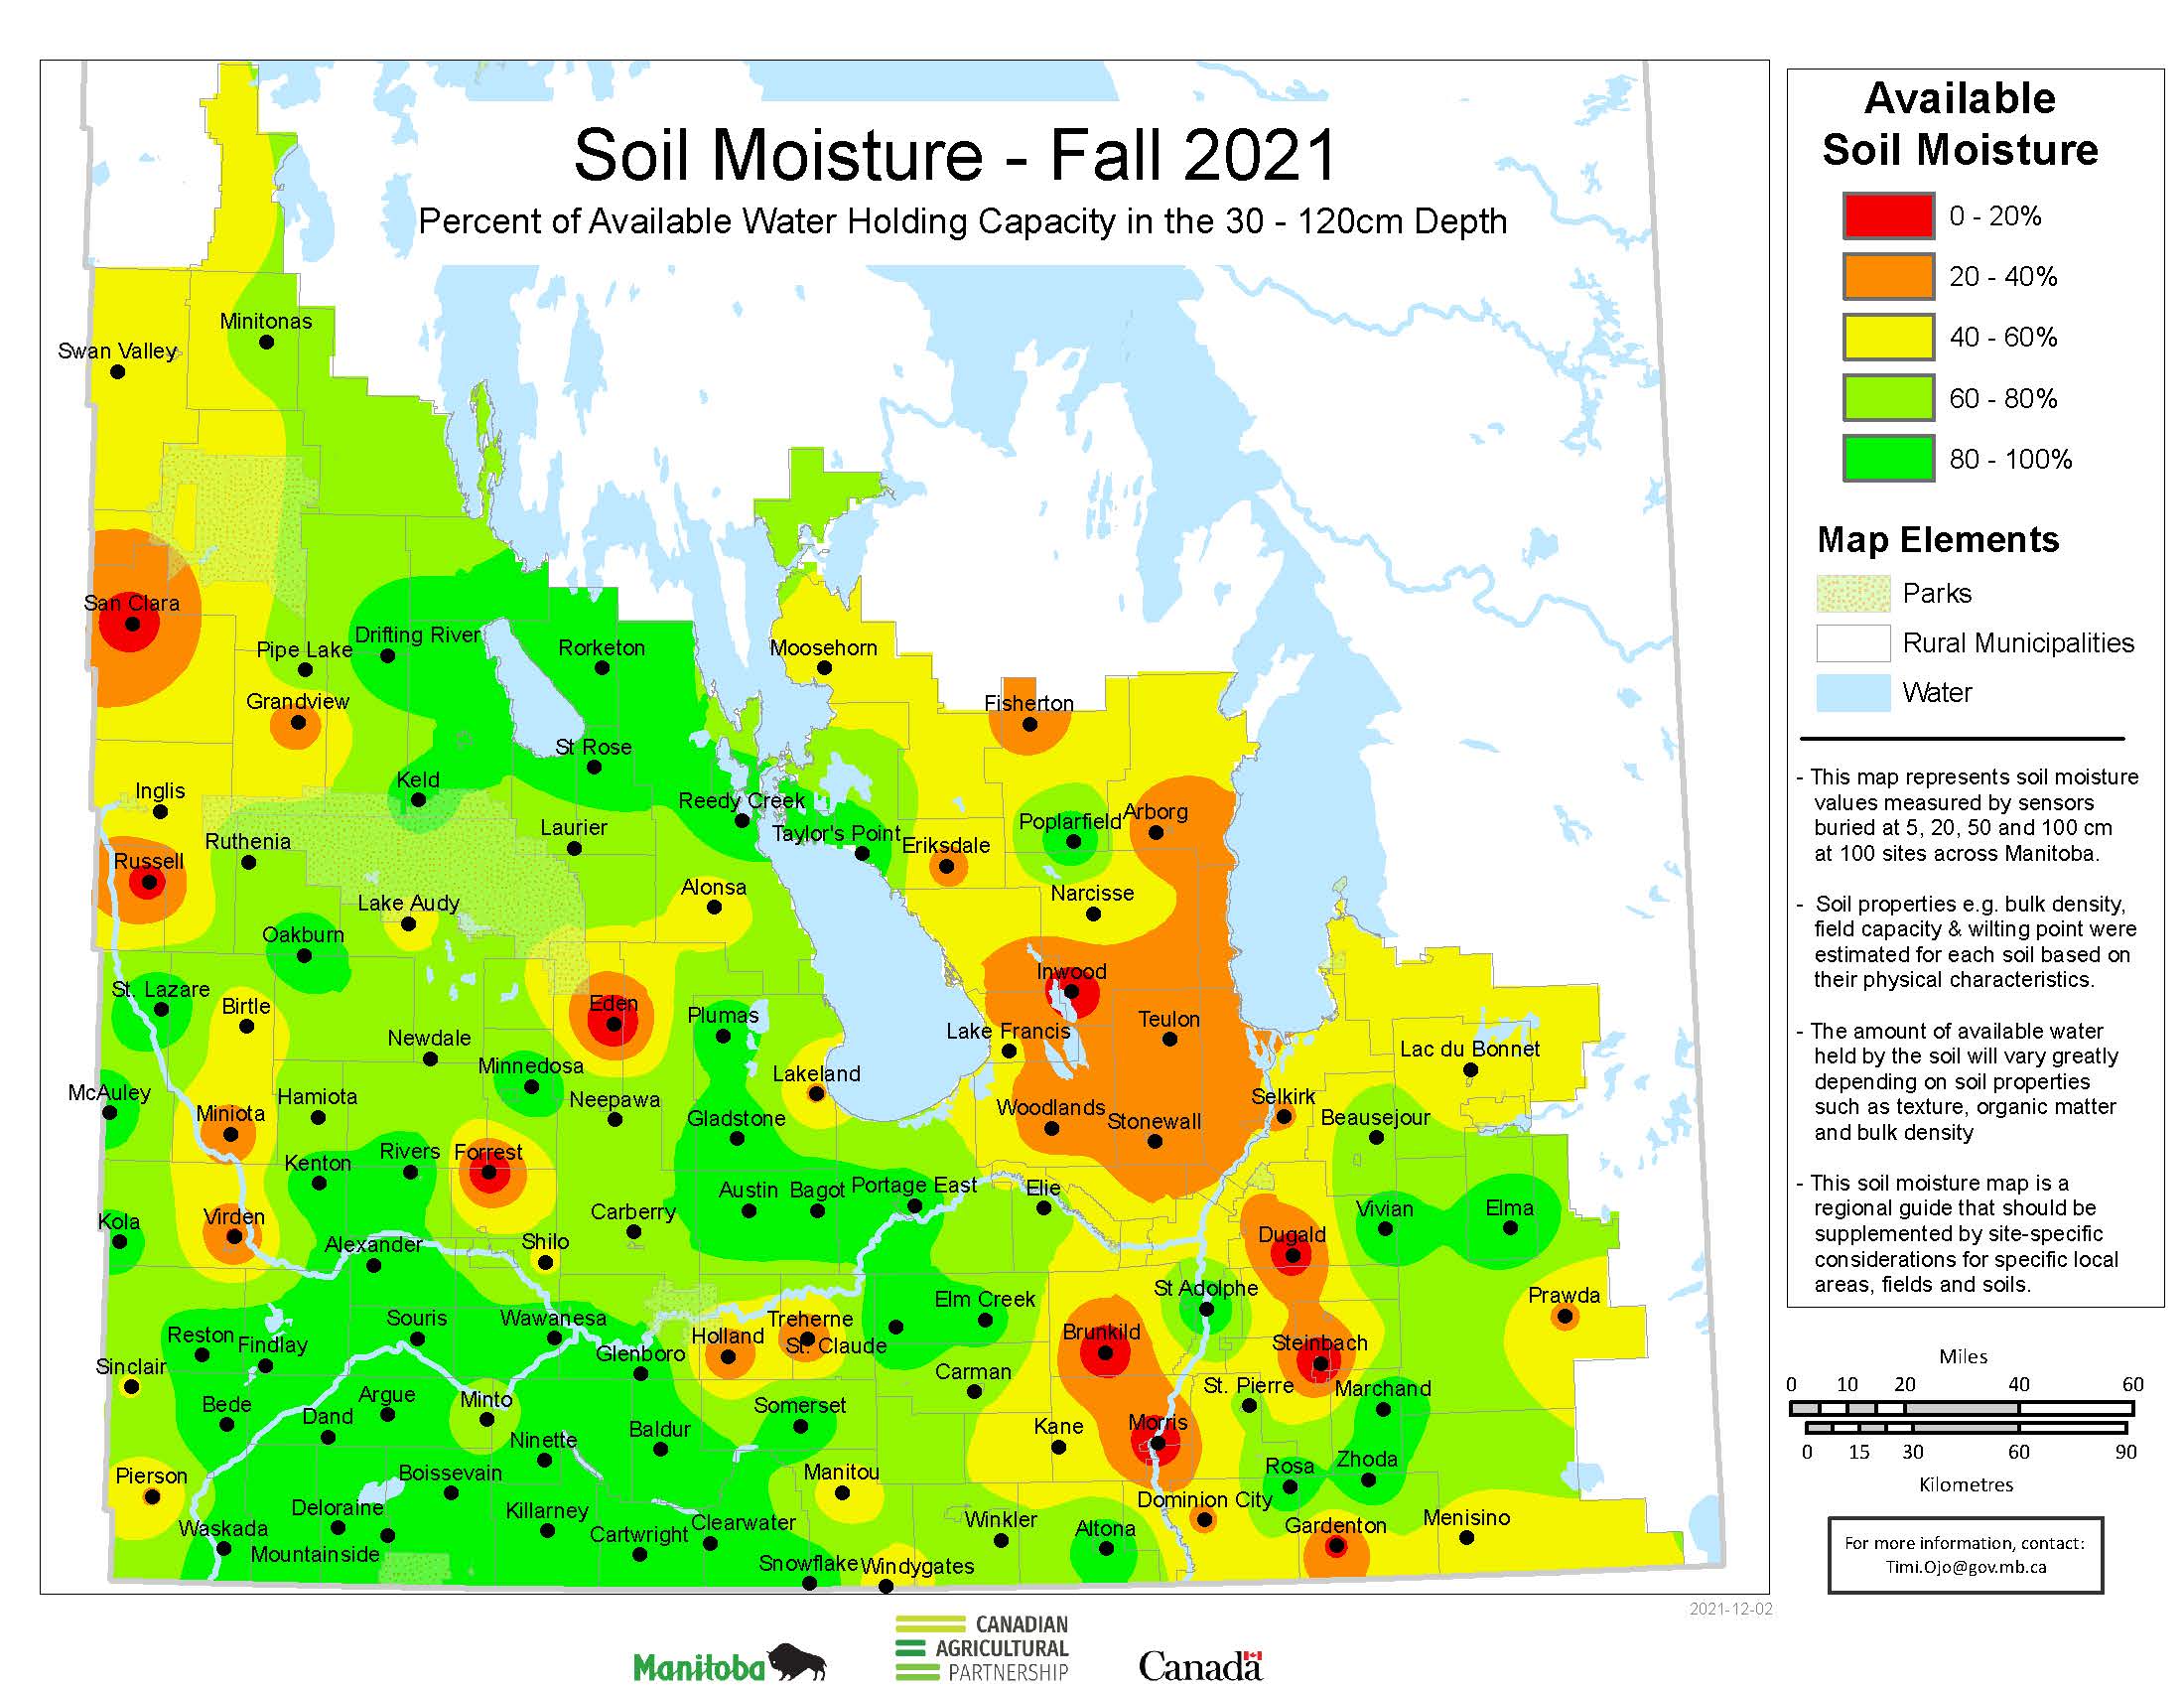
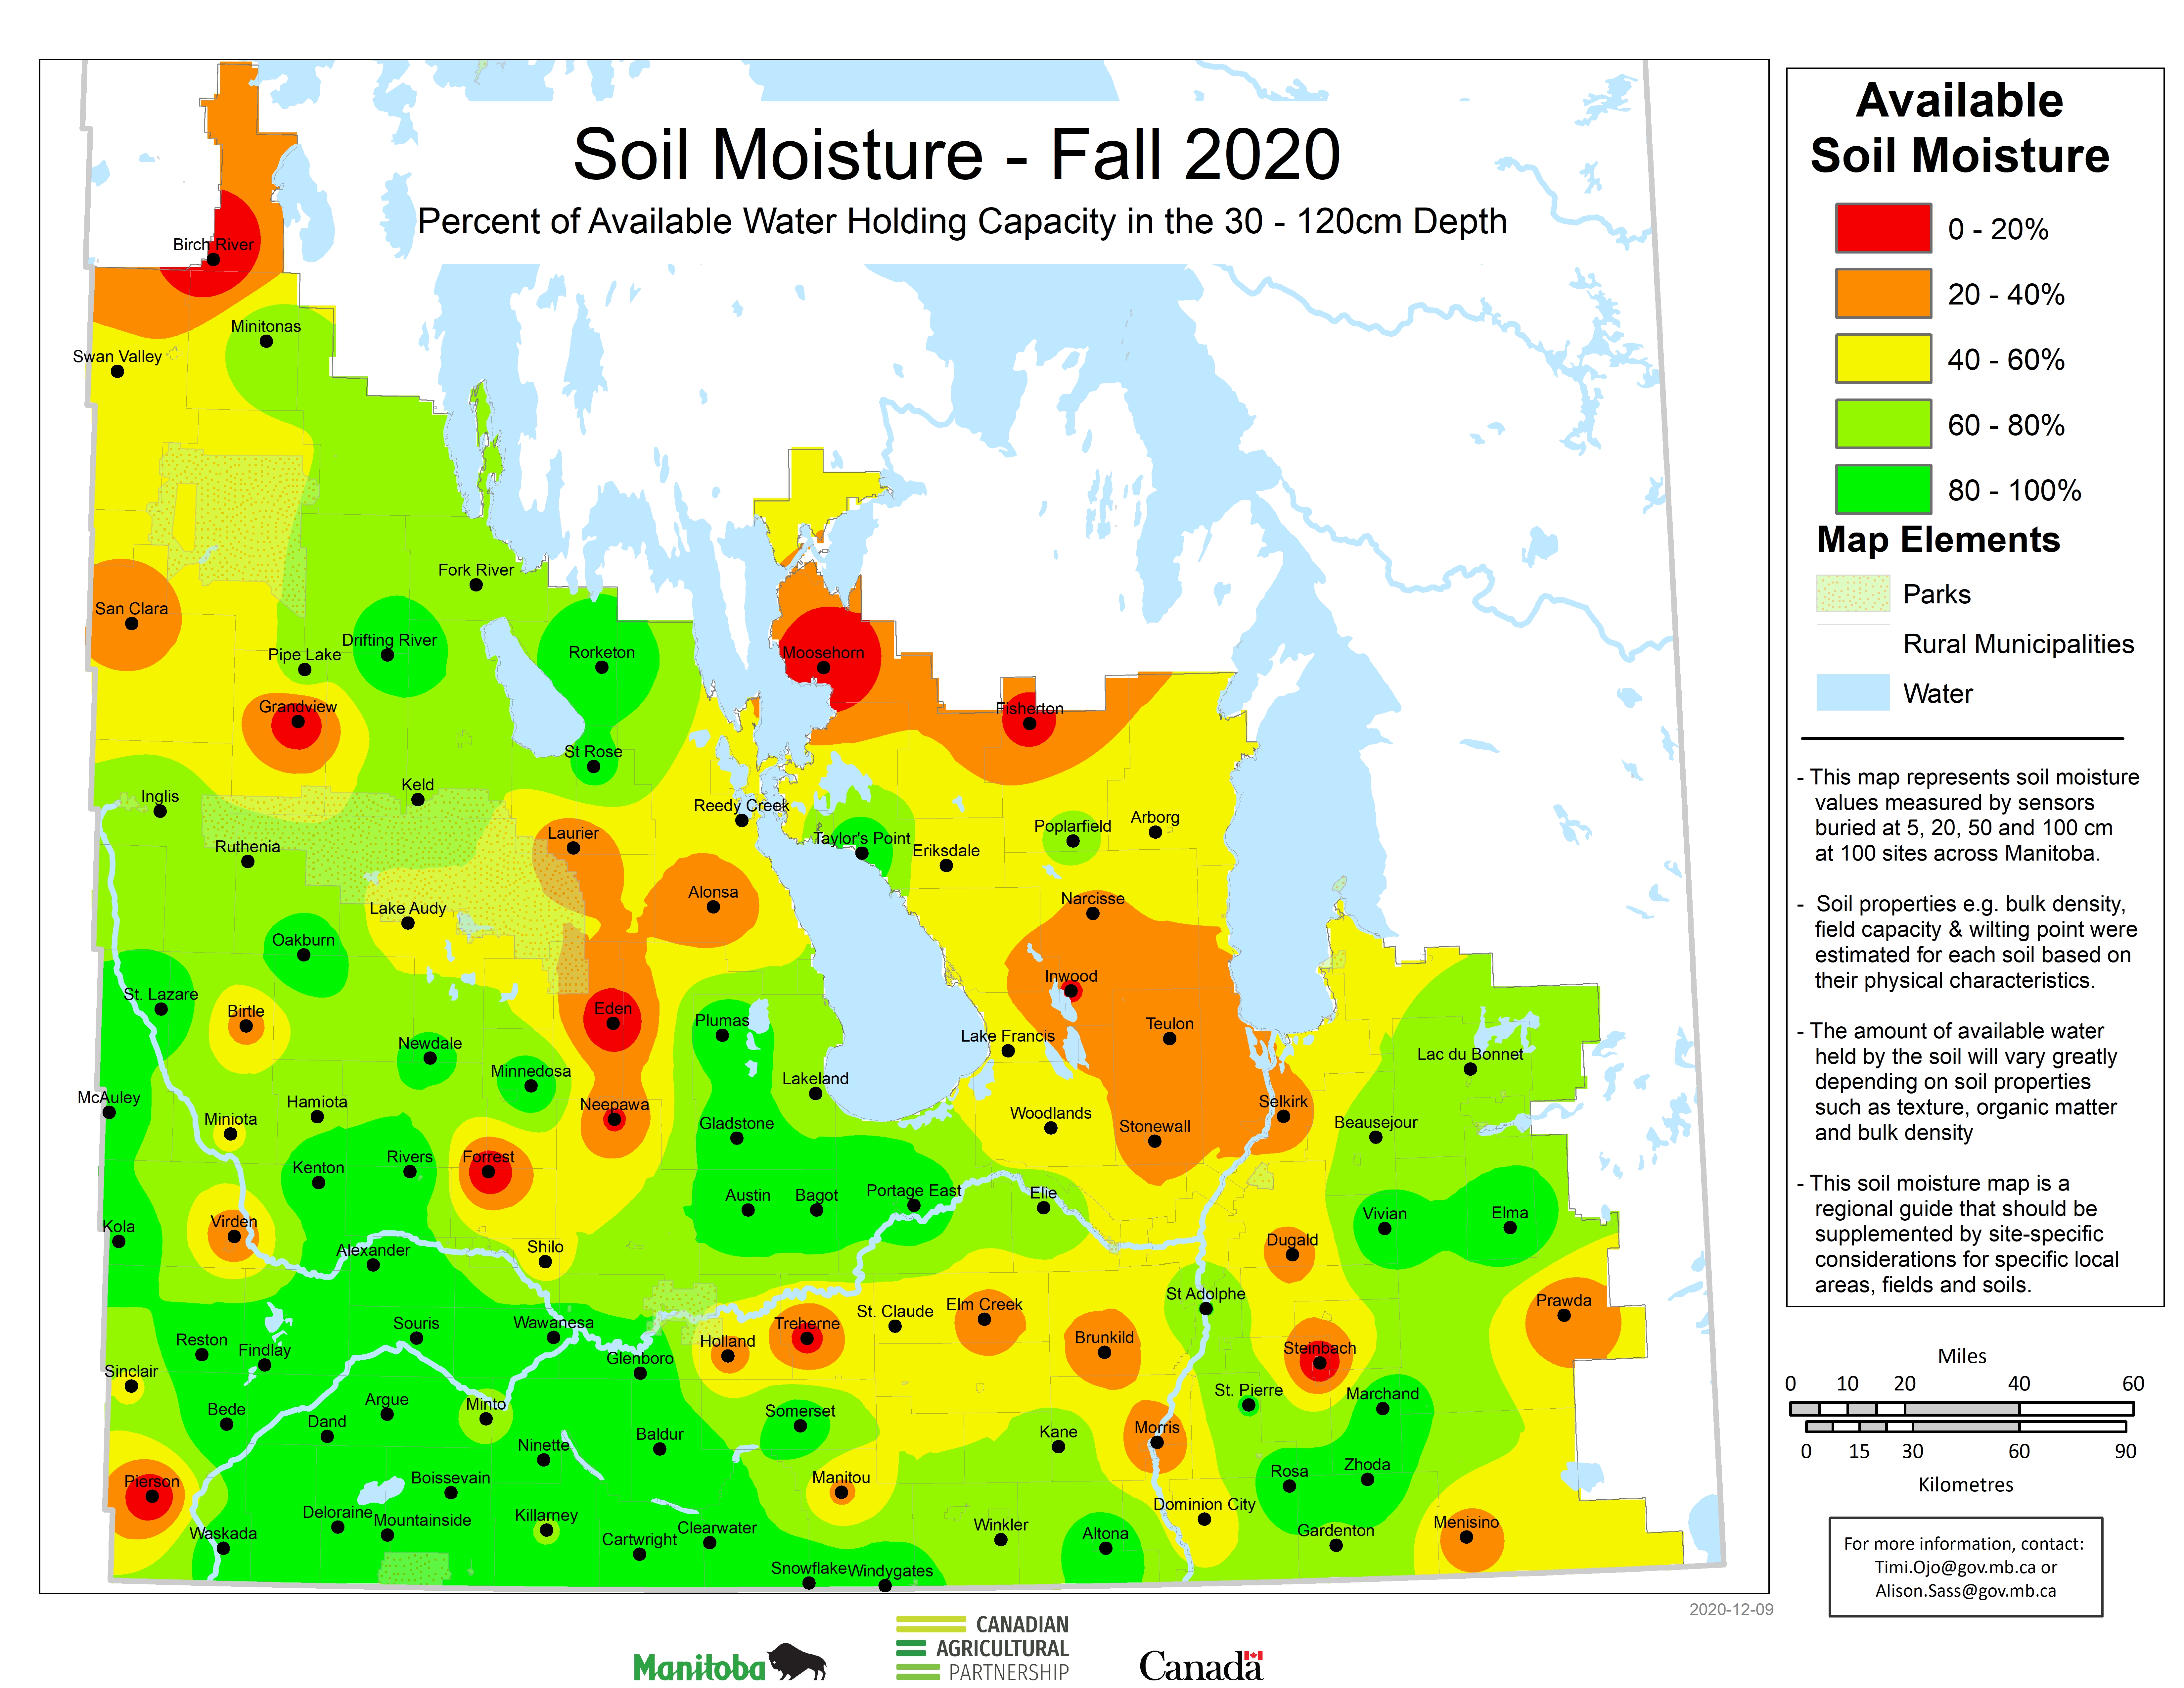
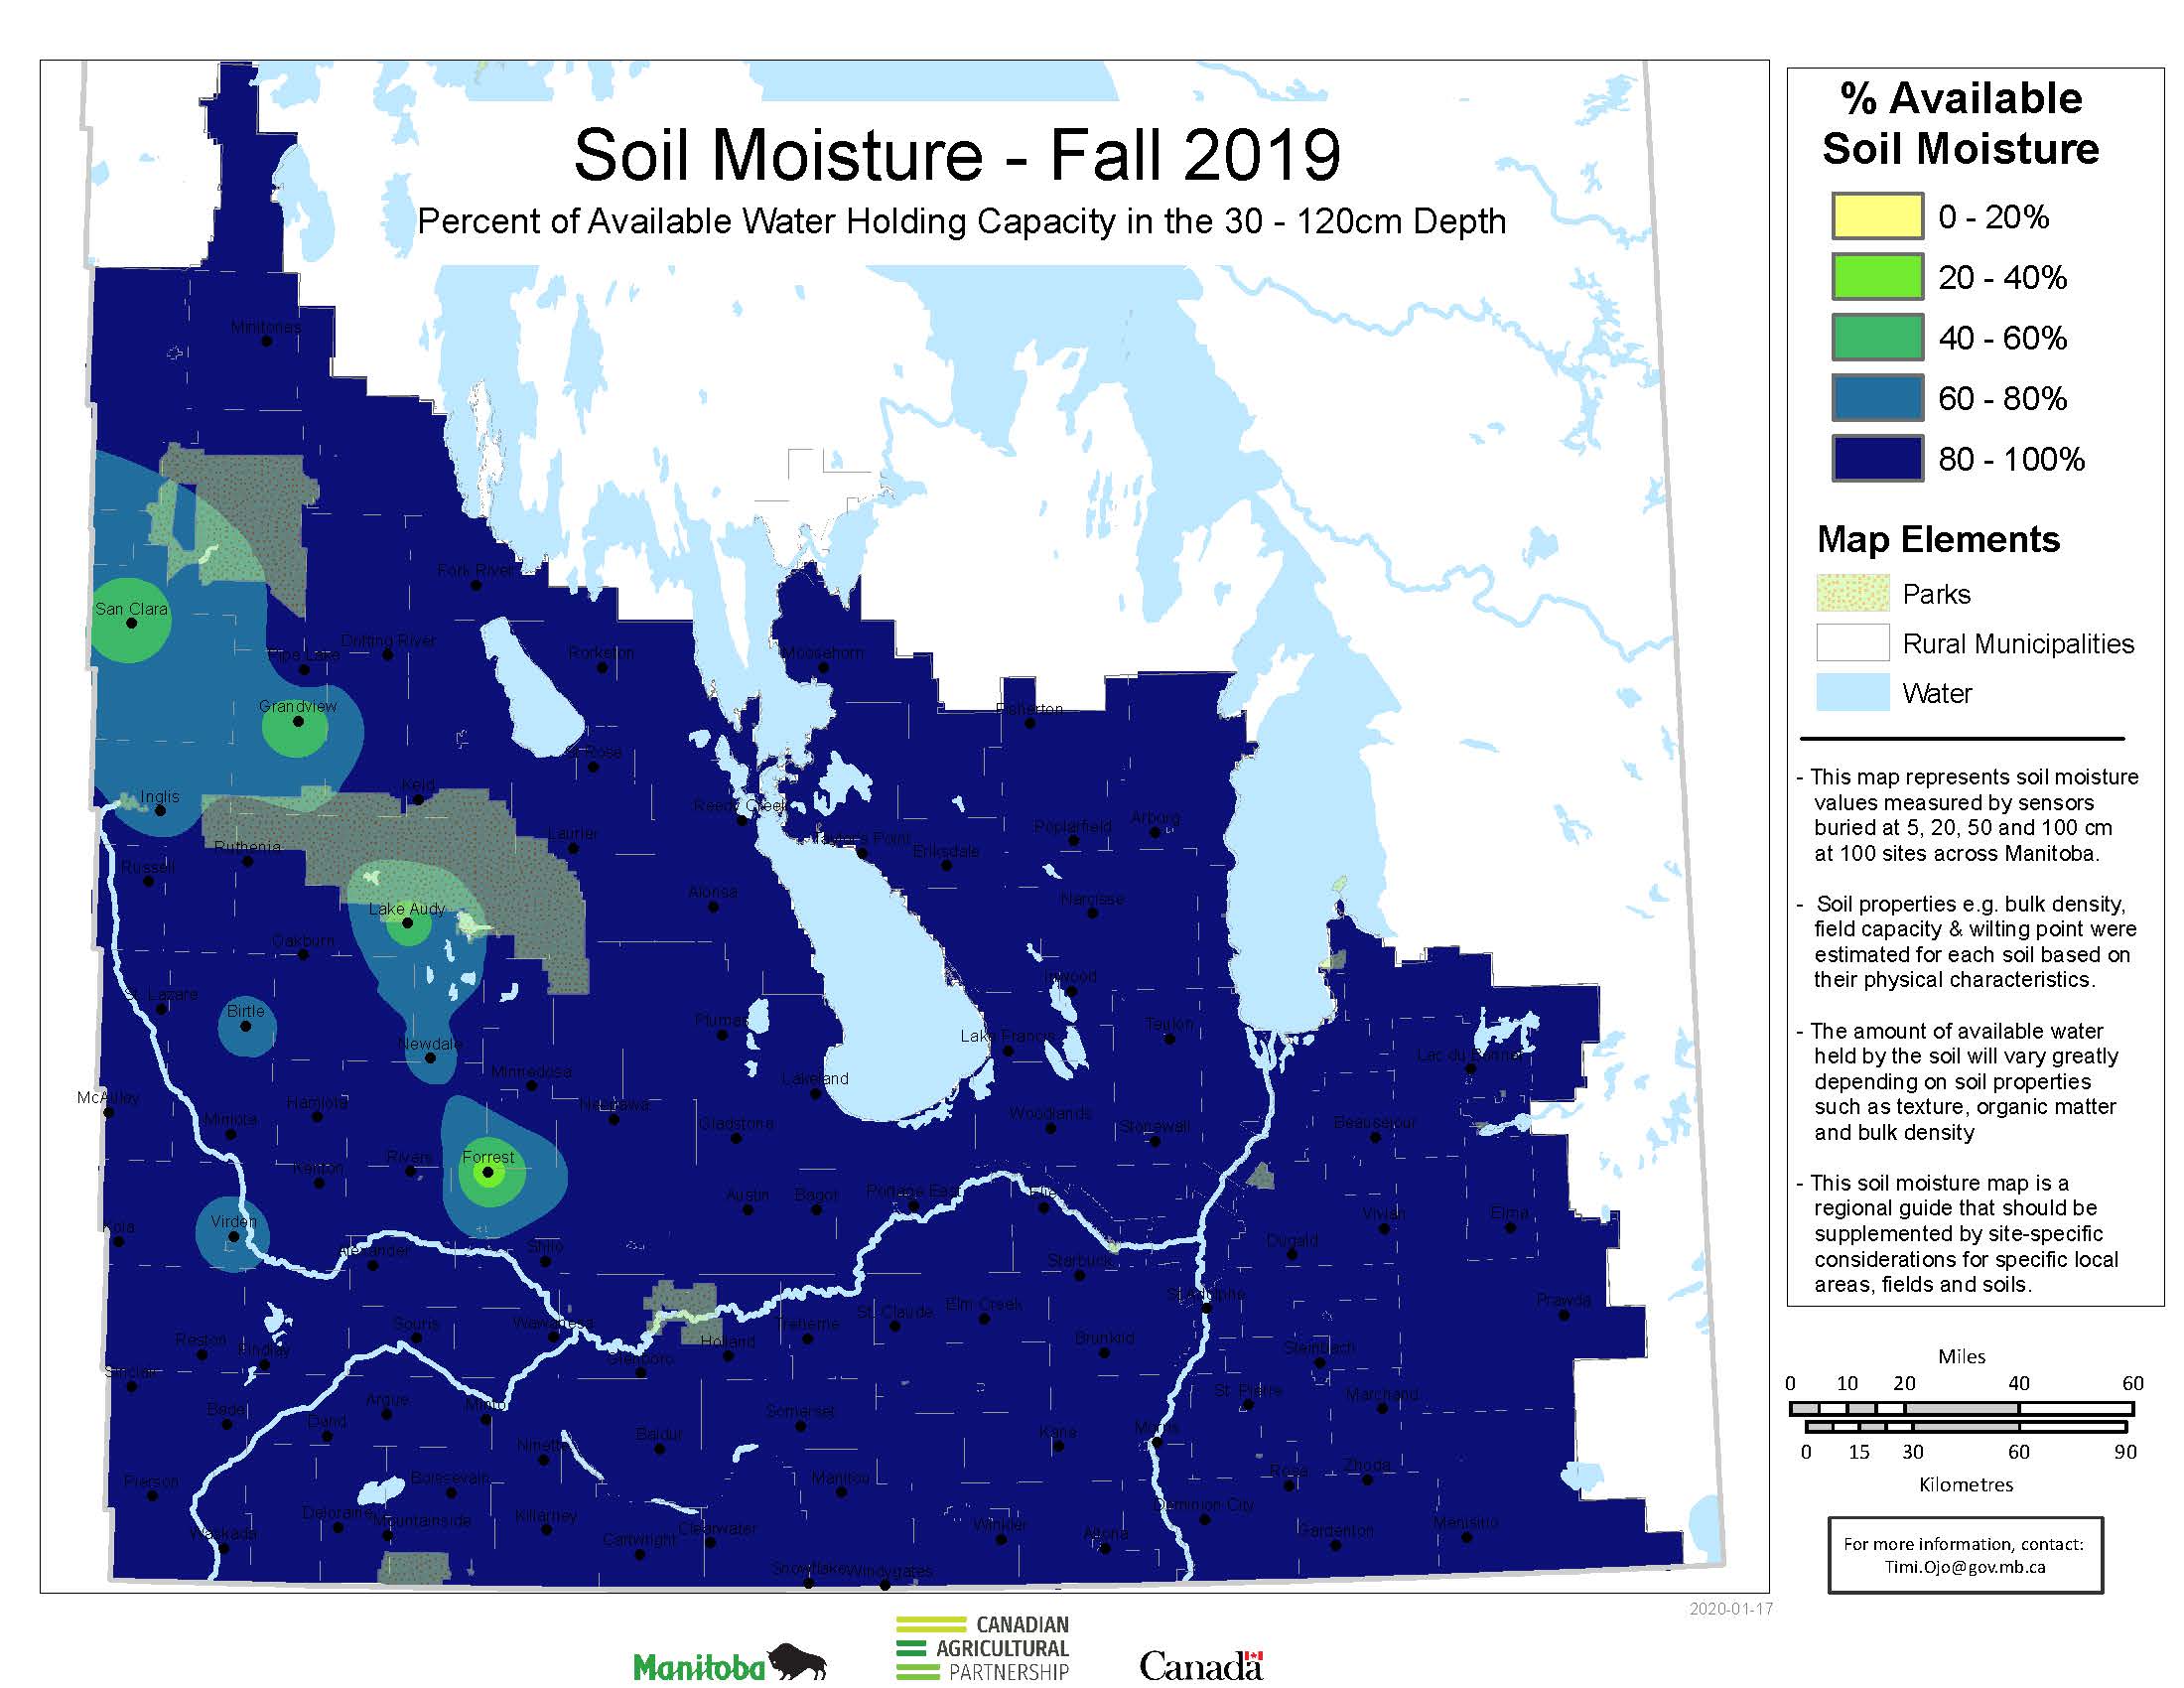
Soil Moisture Survey Results
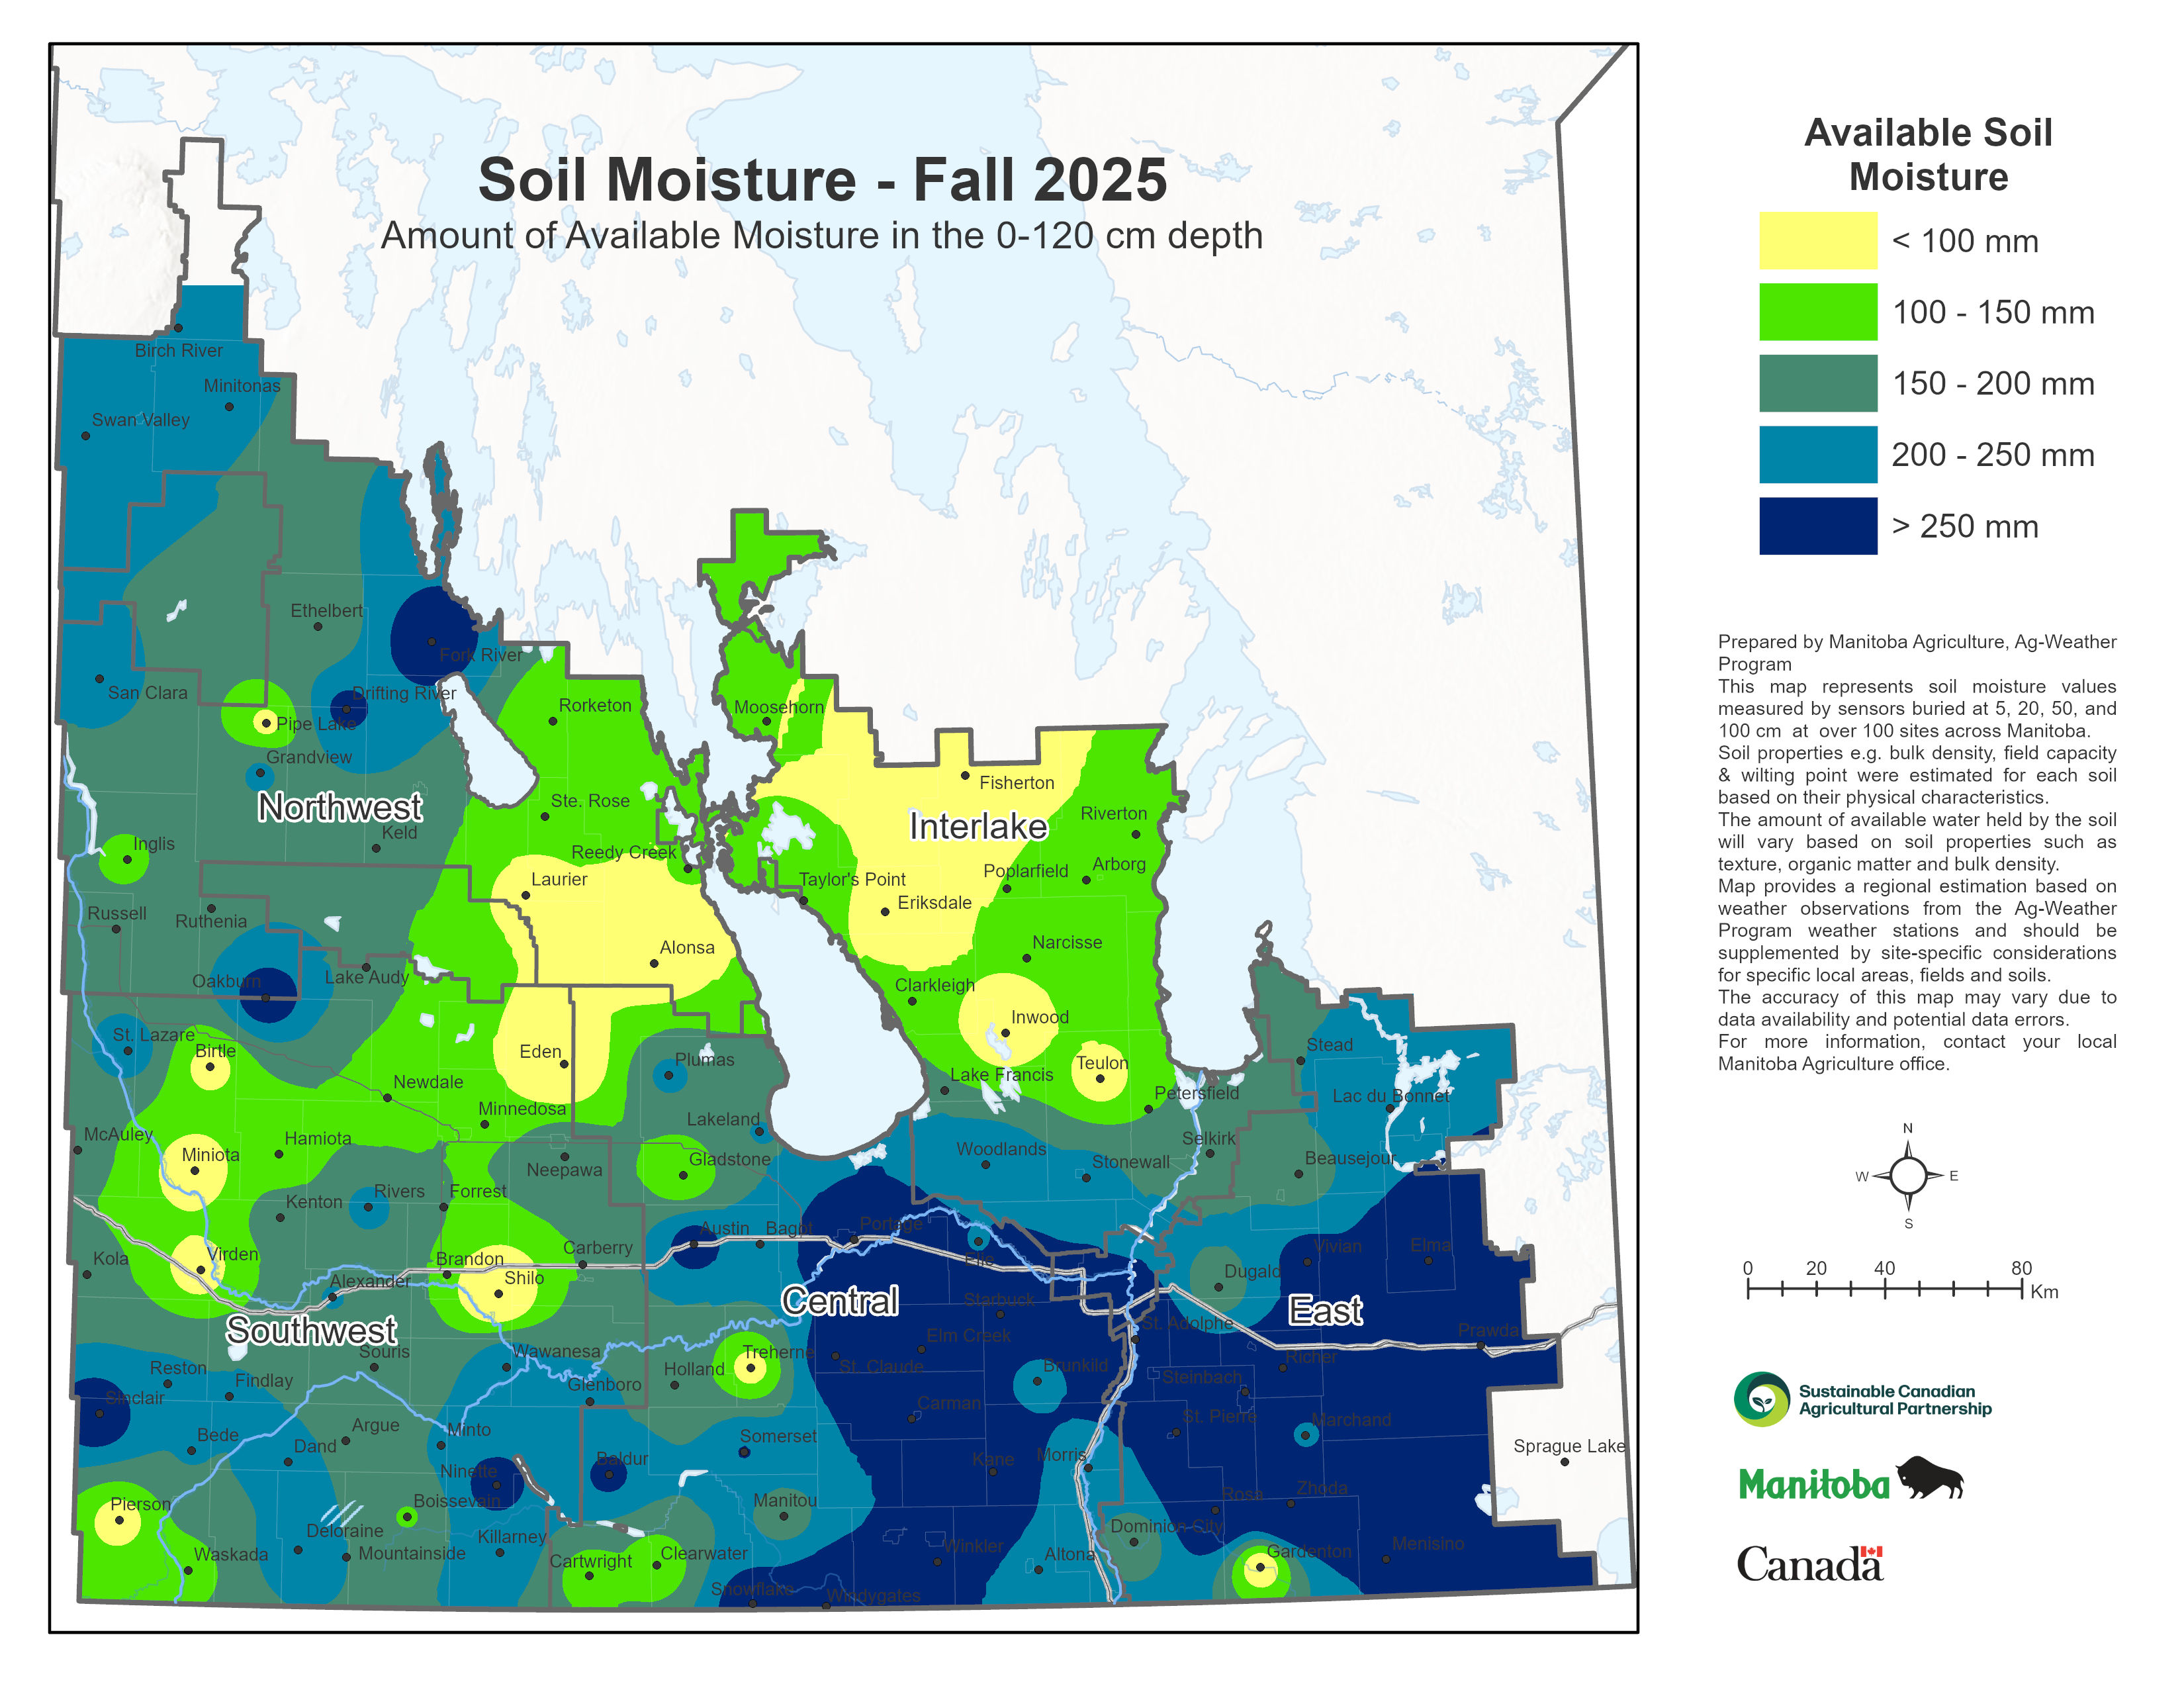
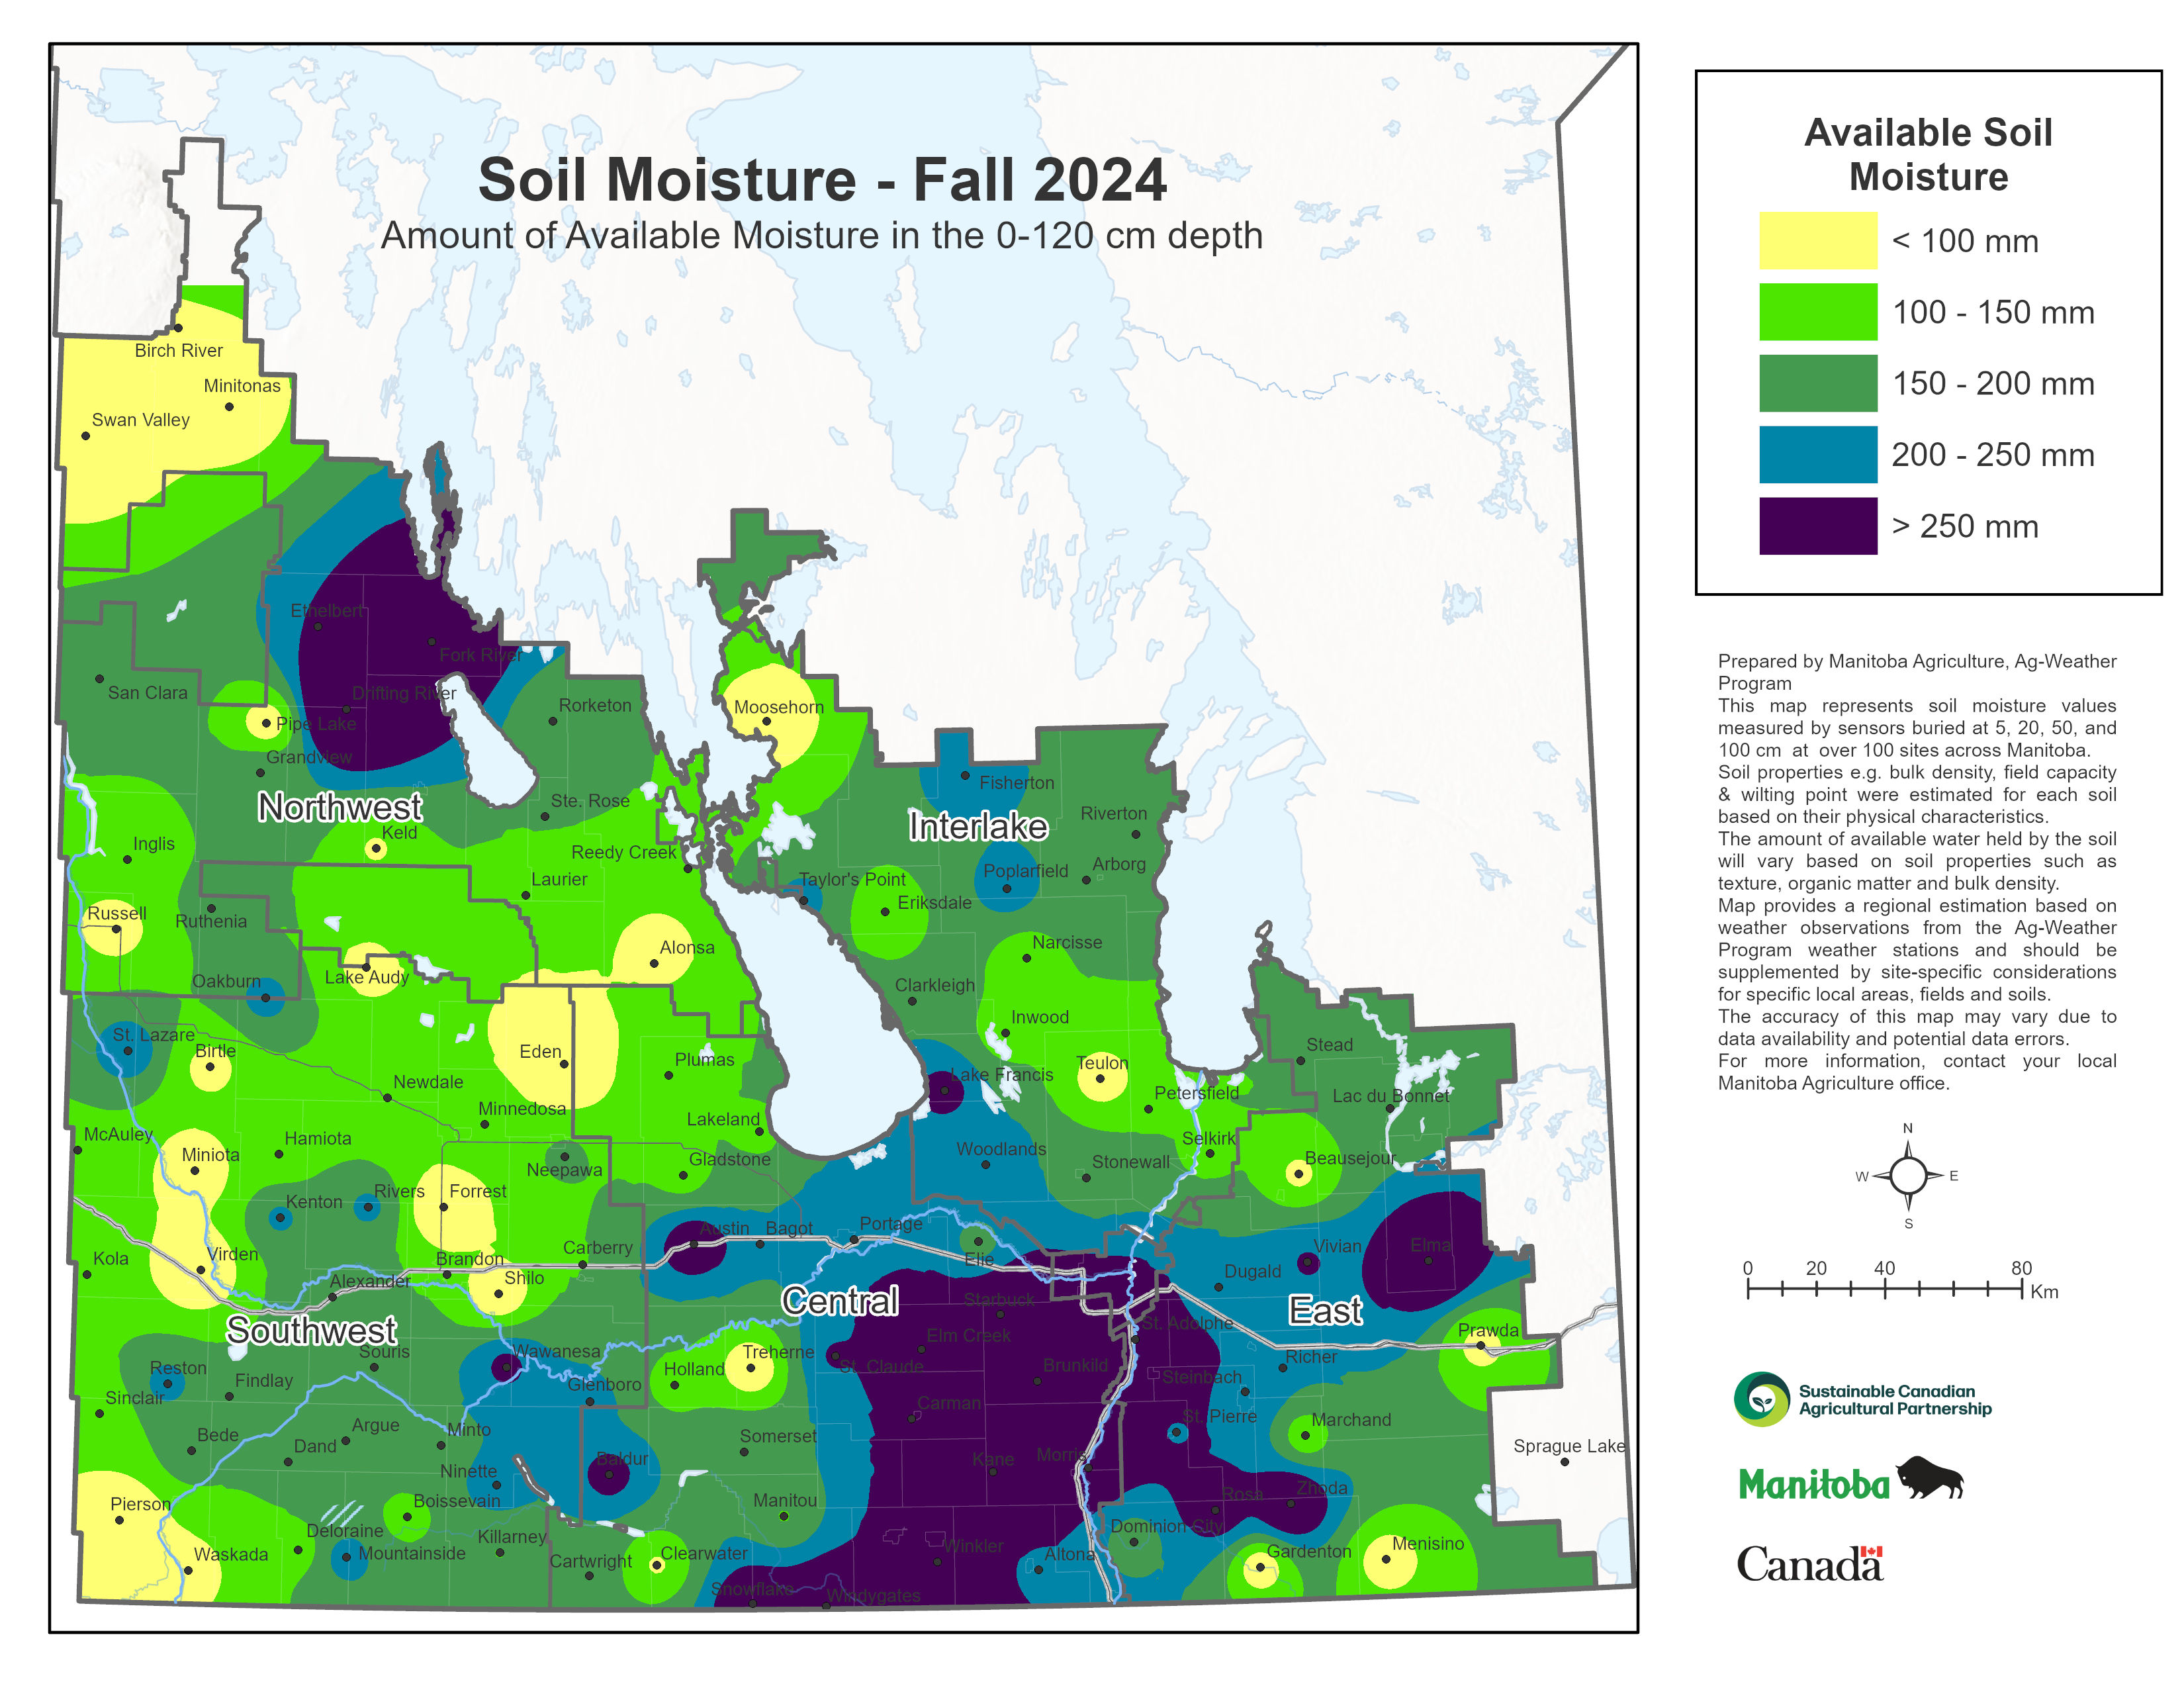
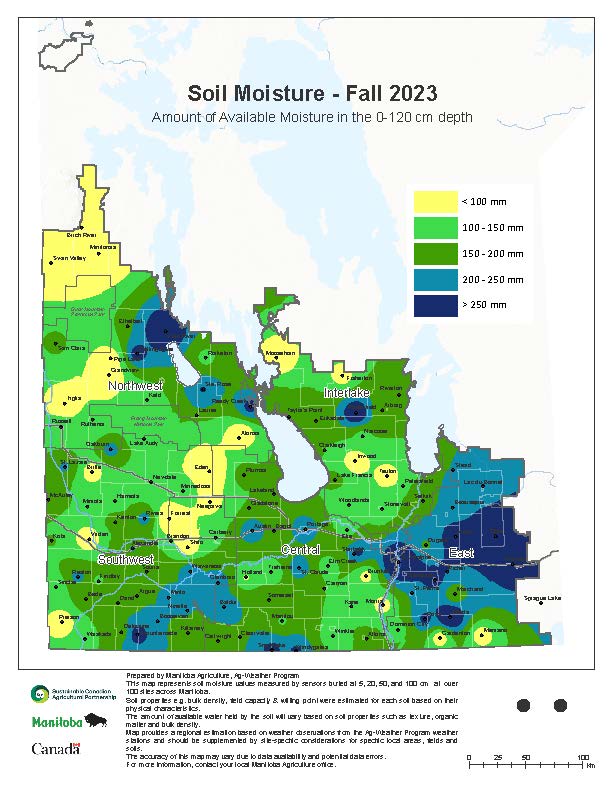
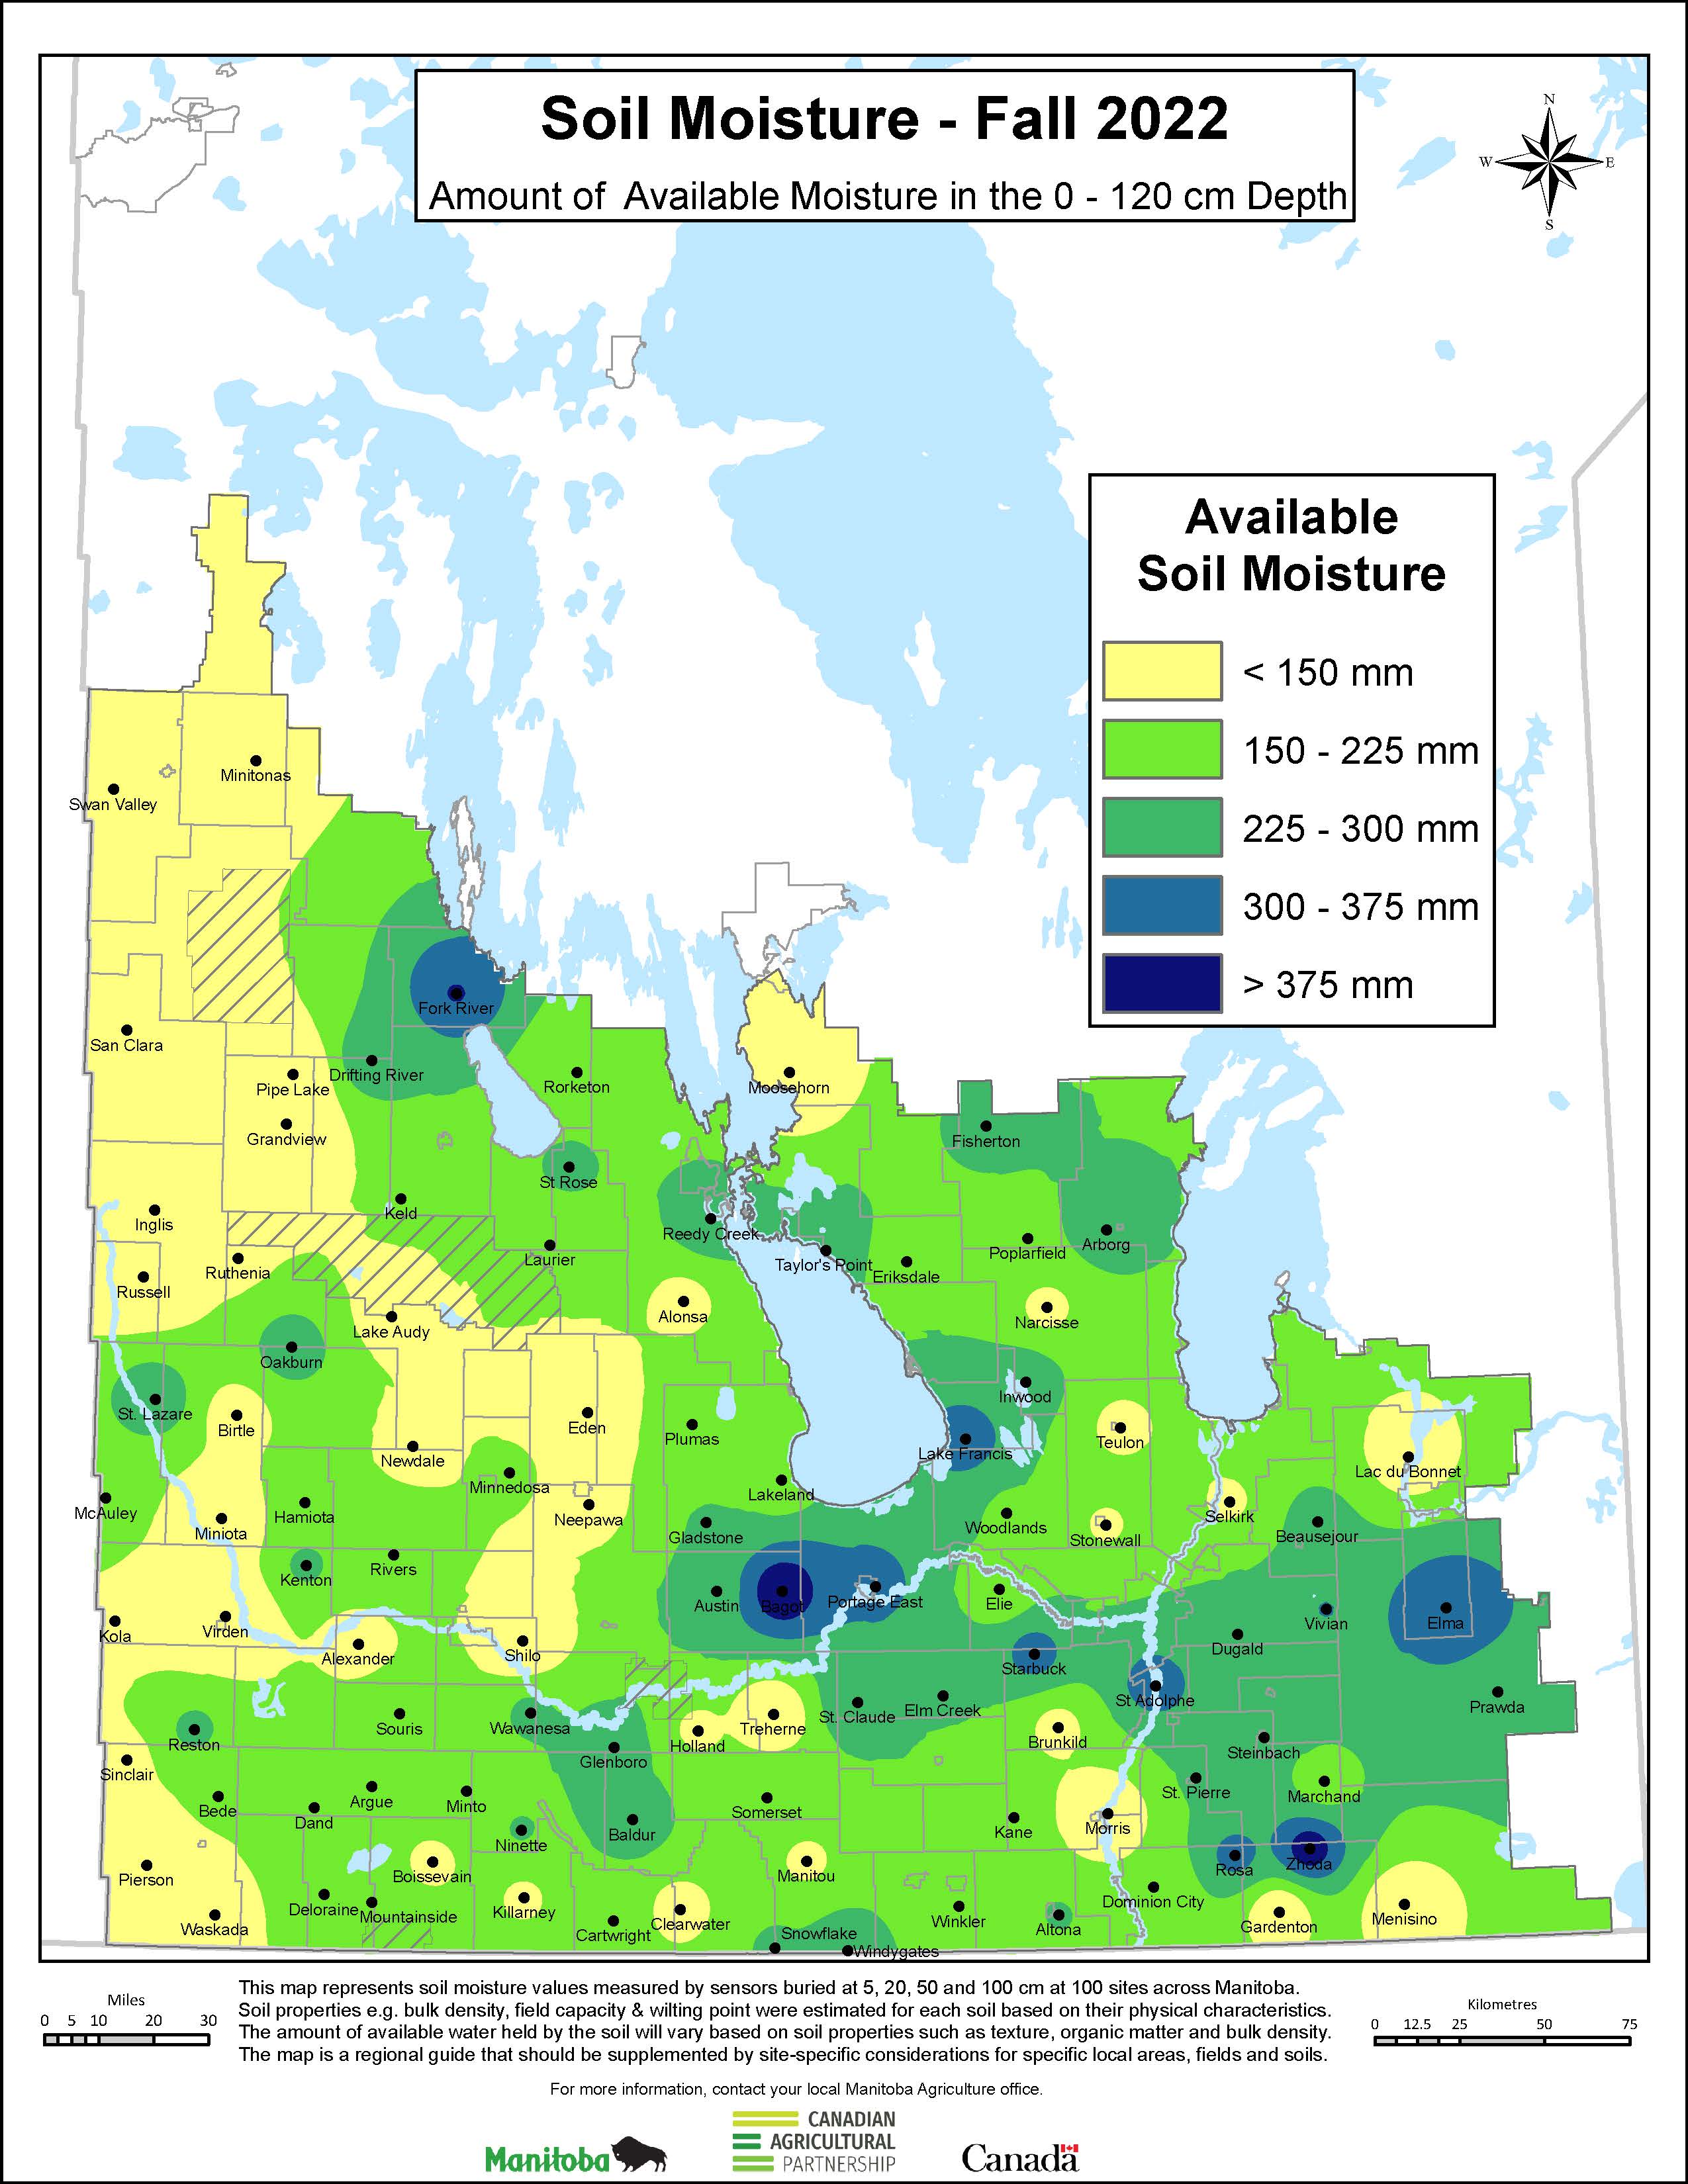
Amount of Available Soil Moisture |
2025 | 2024 | 2023 | 2022 | 2021 | 2020 | 2019 | 2018 | 2017 | 2016 | 2015 |
| Available Moisture – mm of Water in the Root Zone (0 to 120cm) | view | view | view | view | view | view | view | view | view | view | view |
| Available Moisture – mm of Water in the Top Zone (0 to 30cm) | view | view | view | view | view | view | view | view | view | view | view |
| Available Moisture – mm of Water in the Sub Zone (30 to 120cm) | view | view | view | view | view | view | view | view | view | view | view |
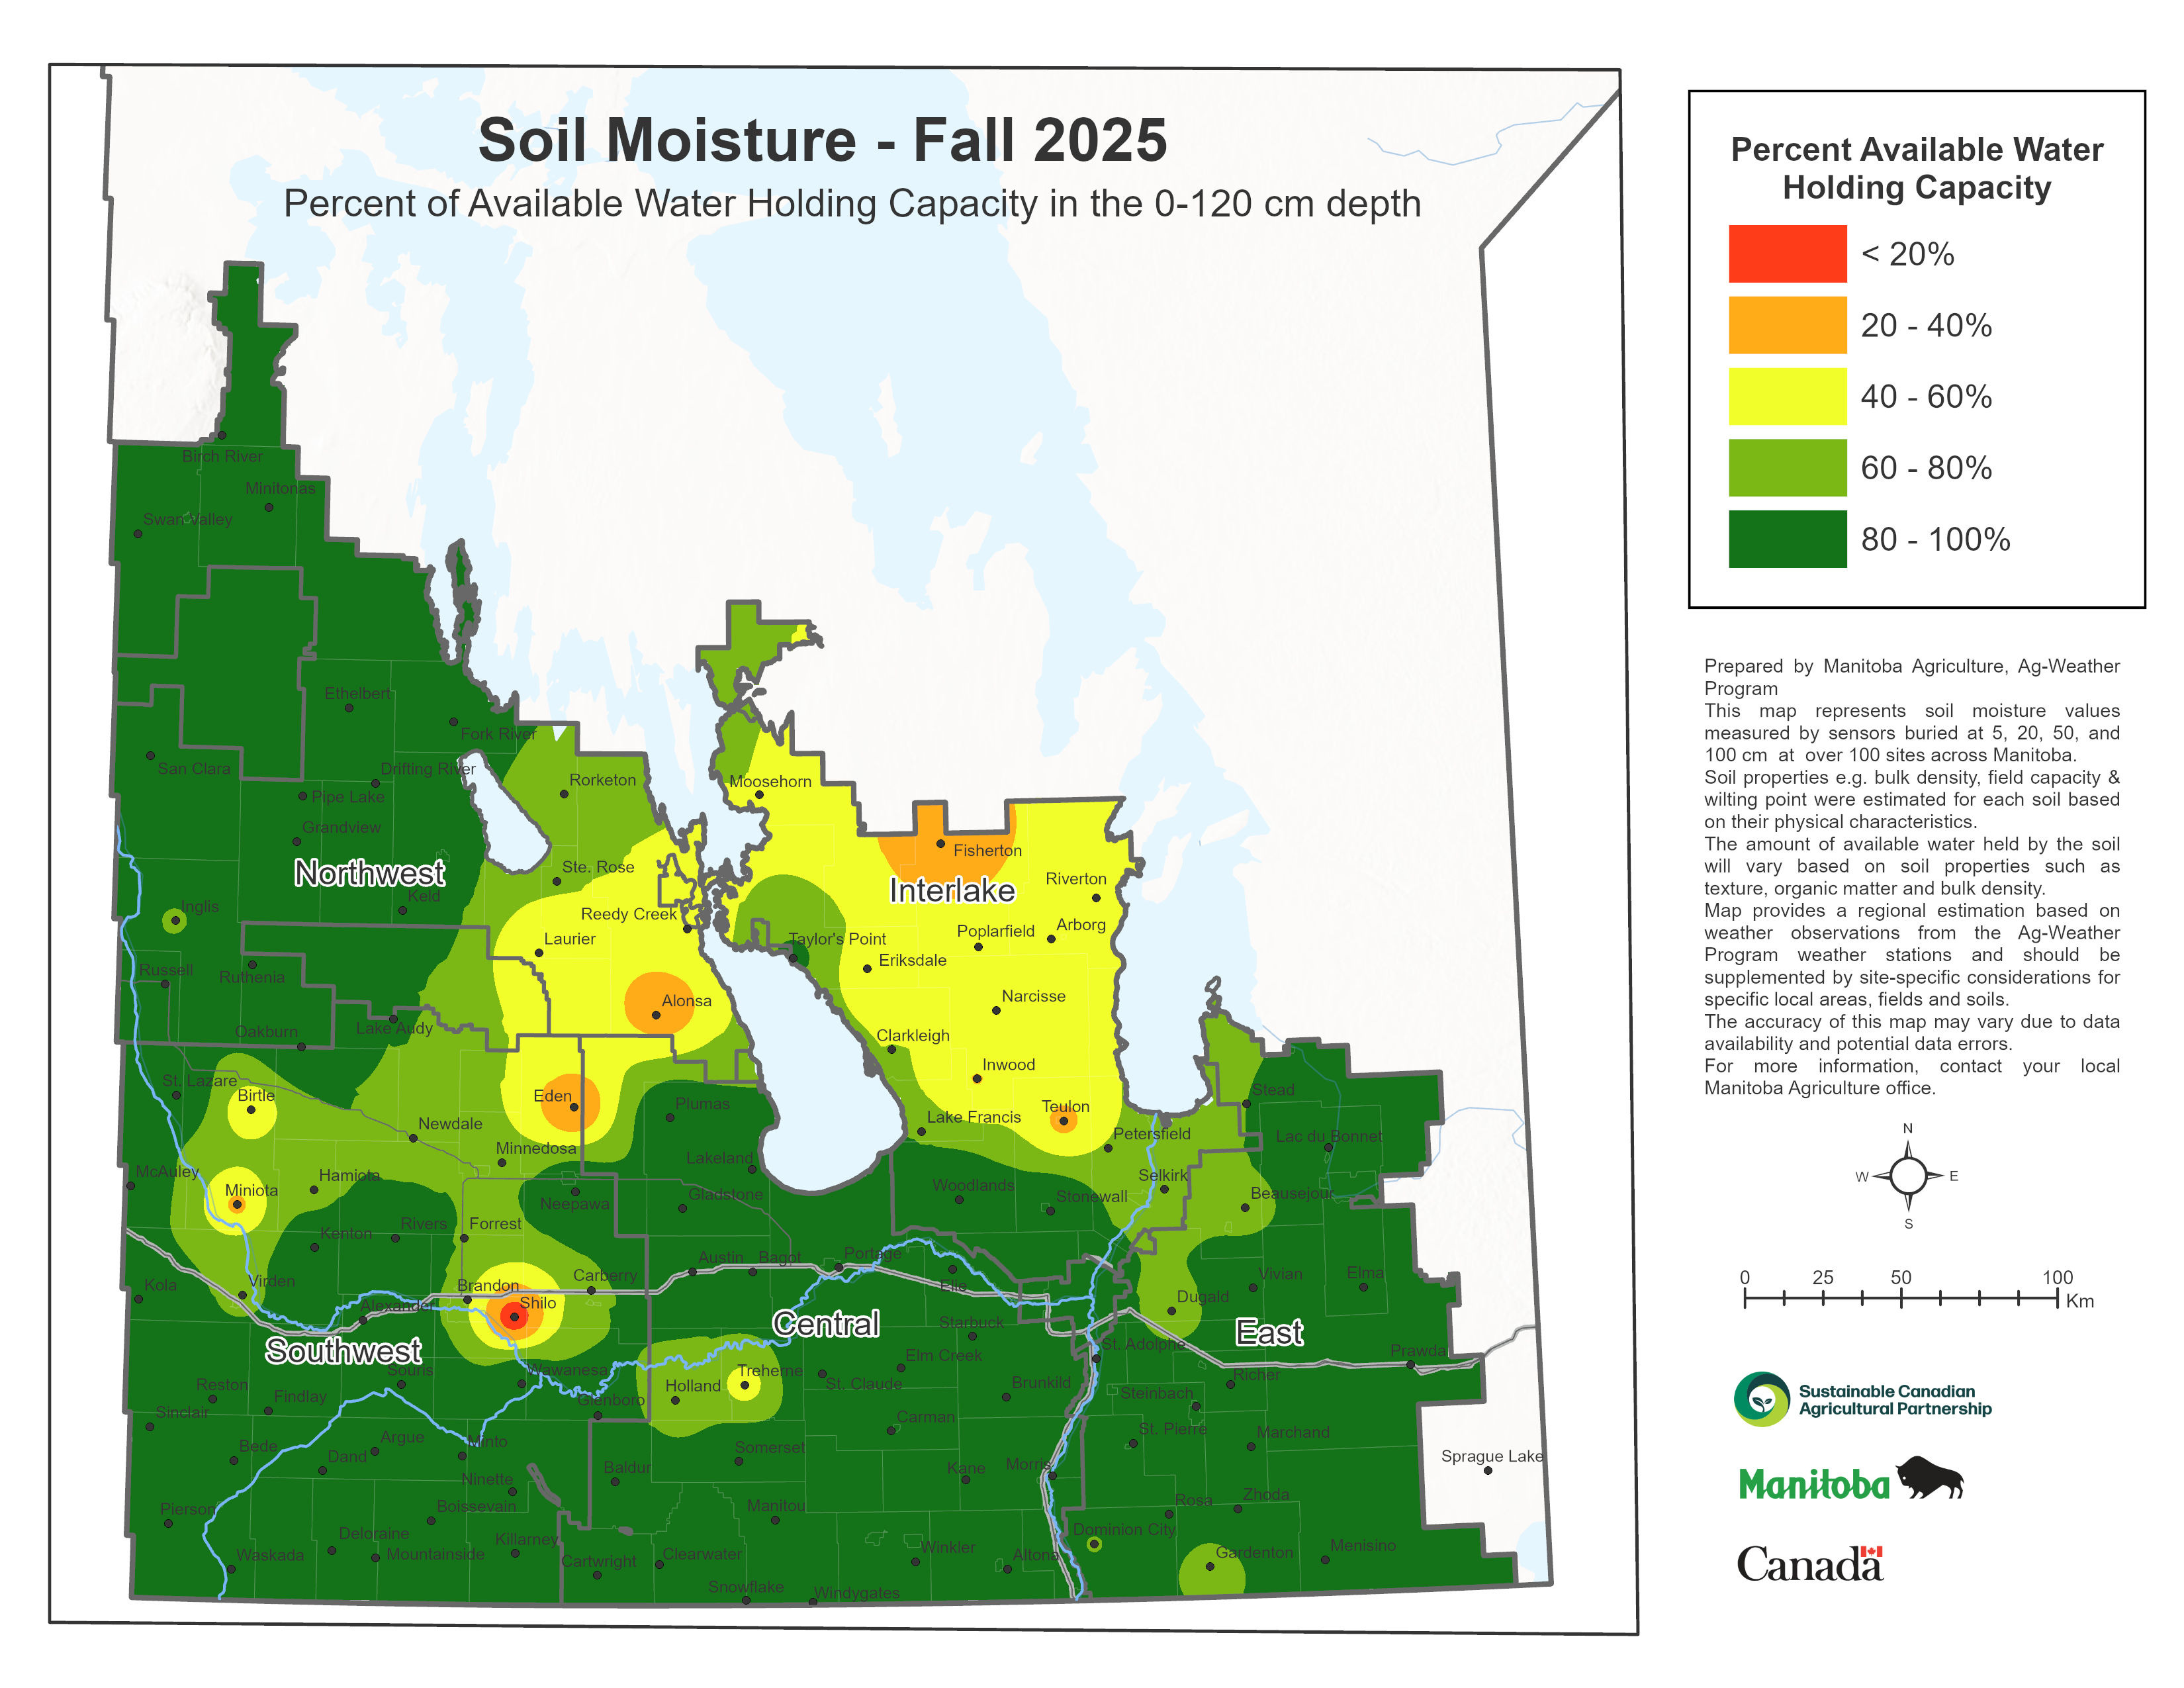
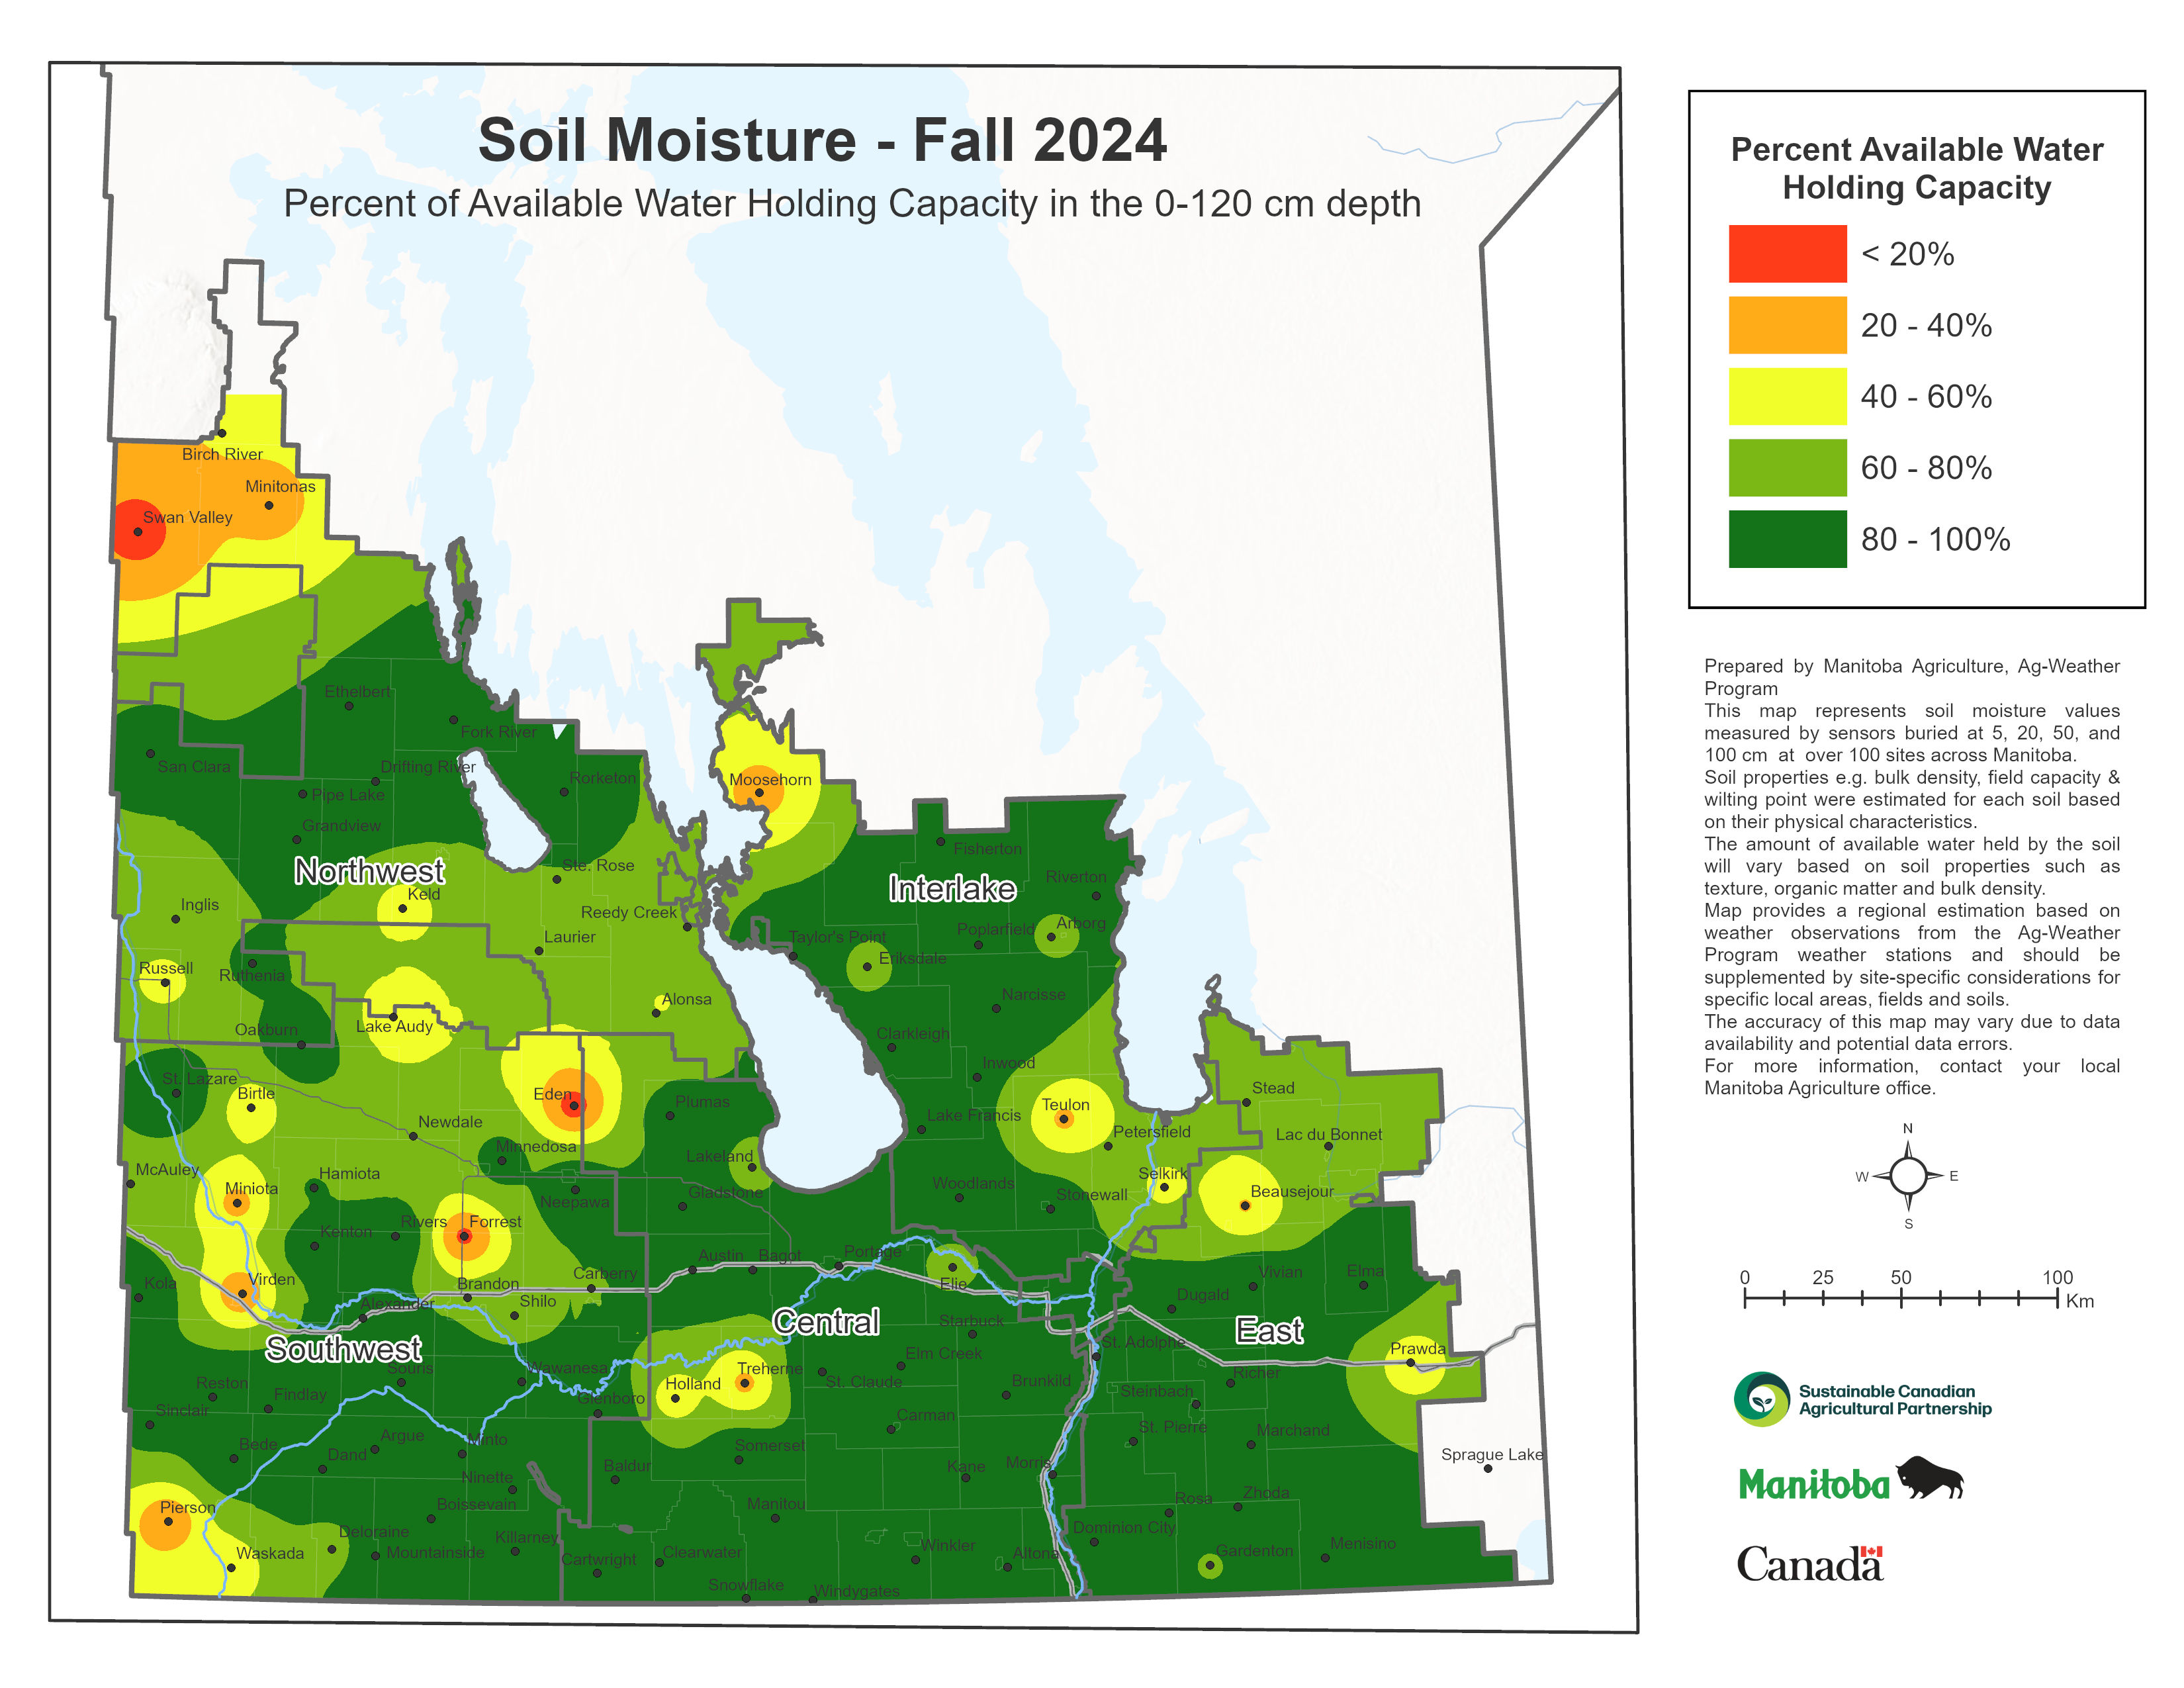
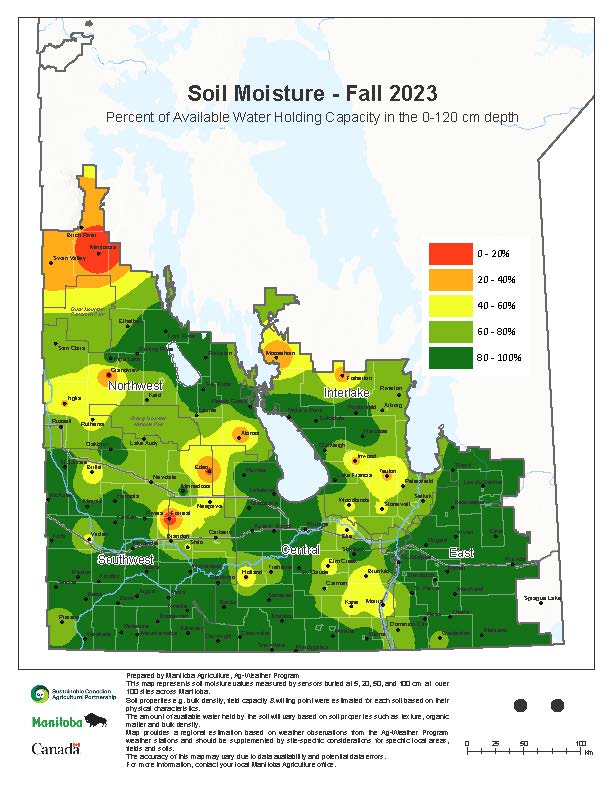
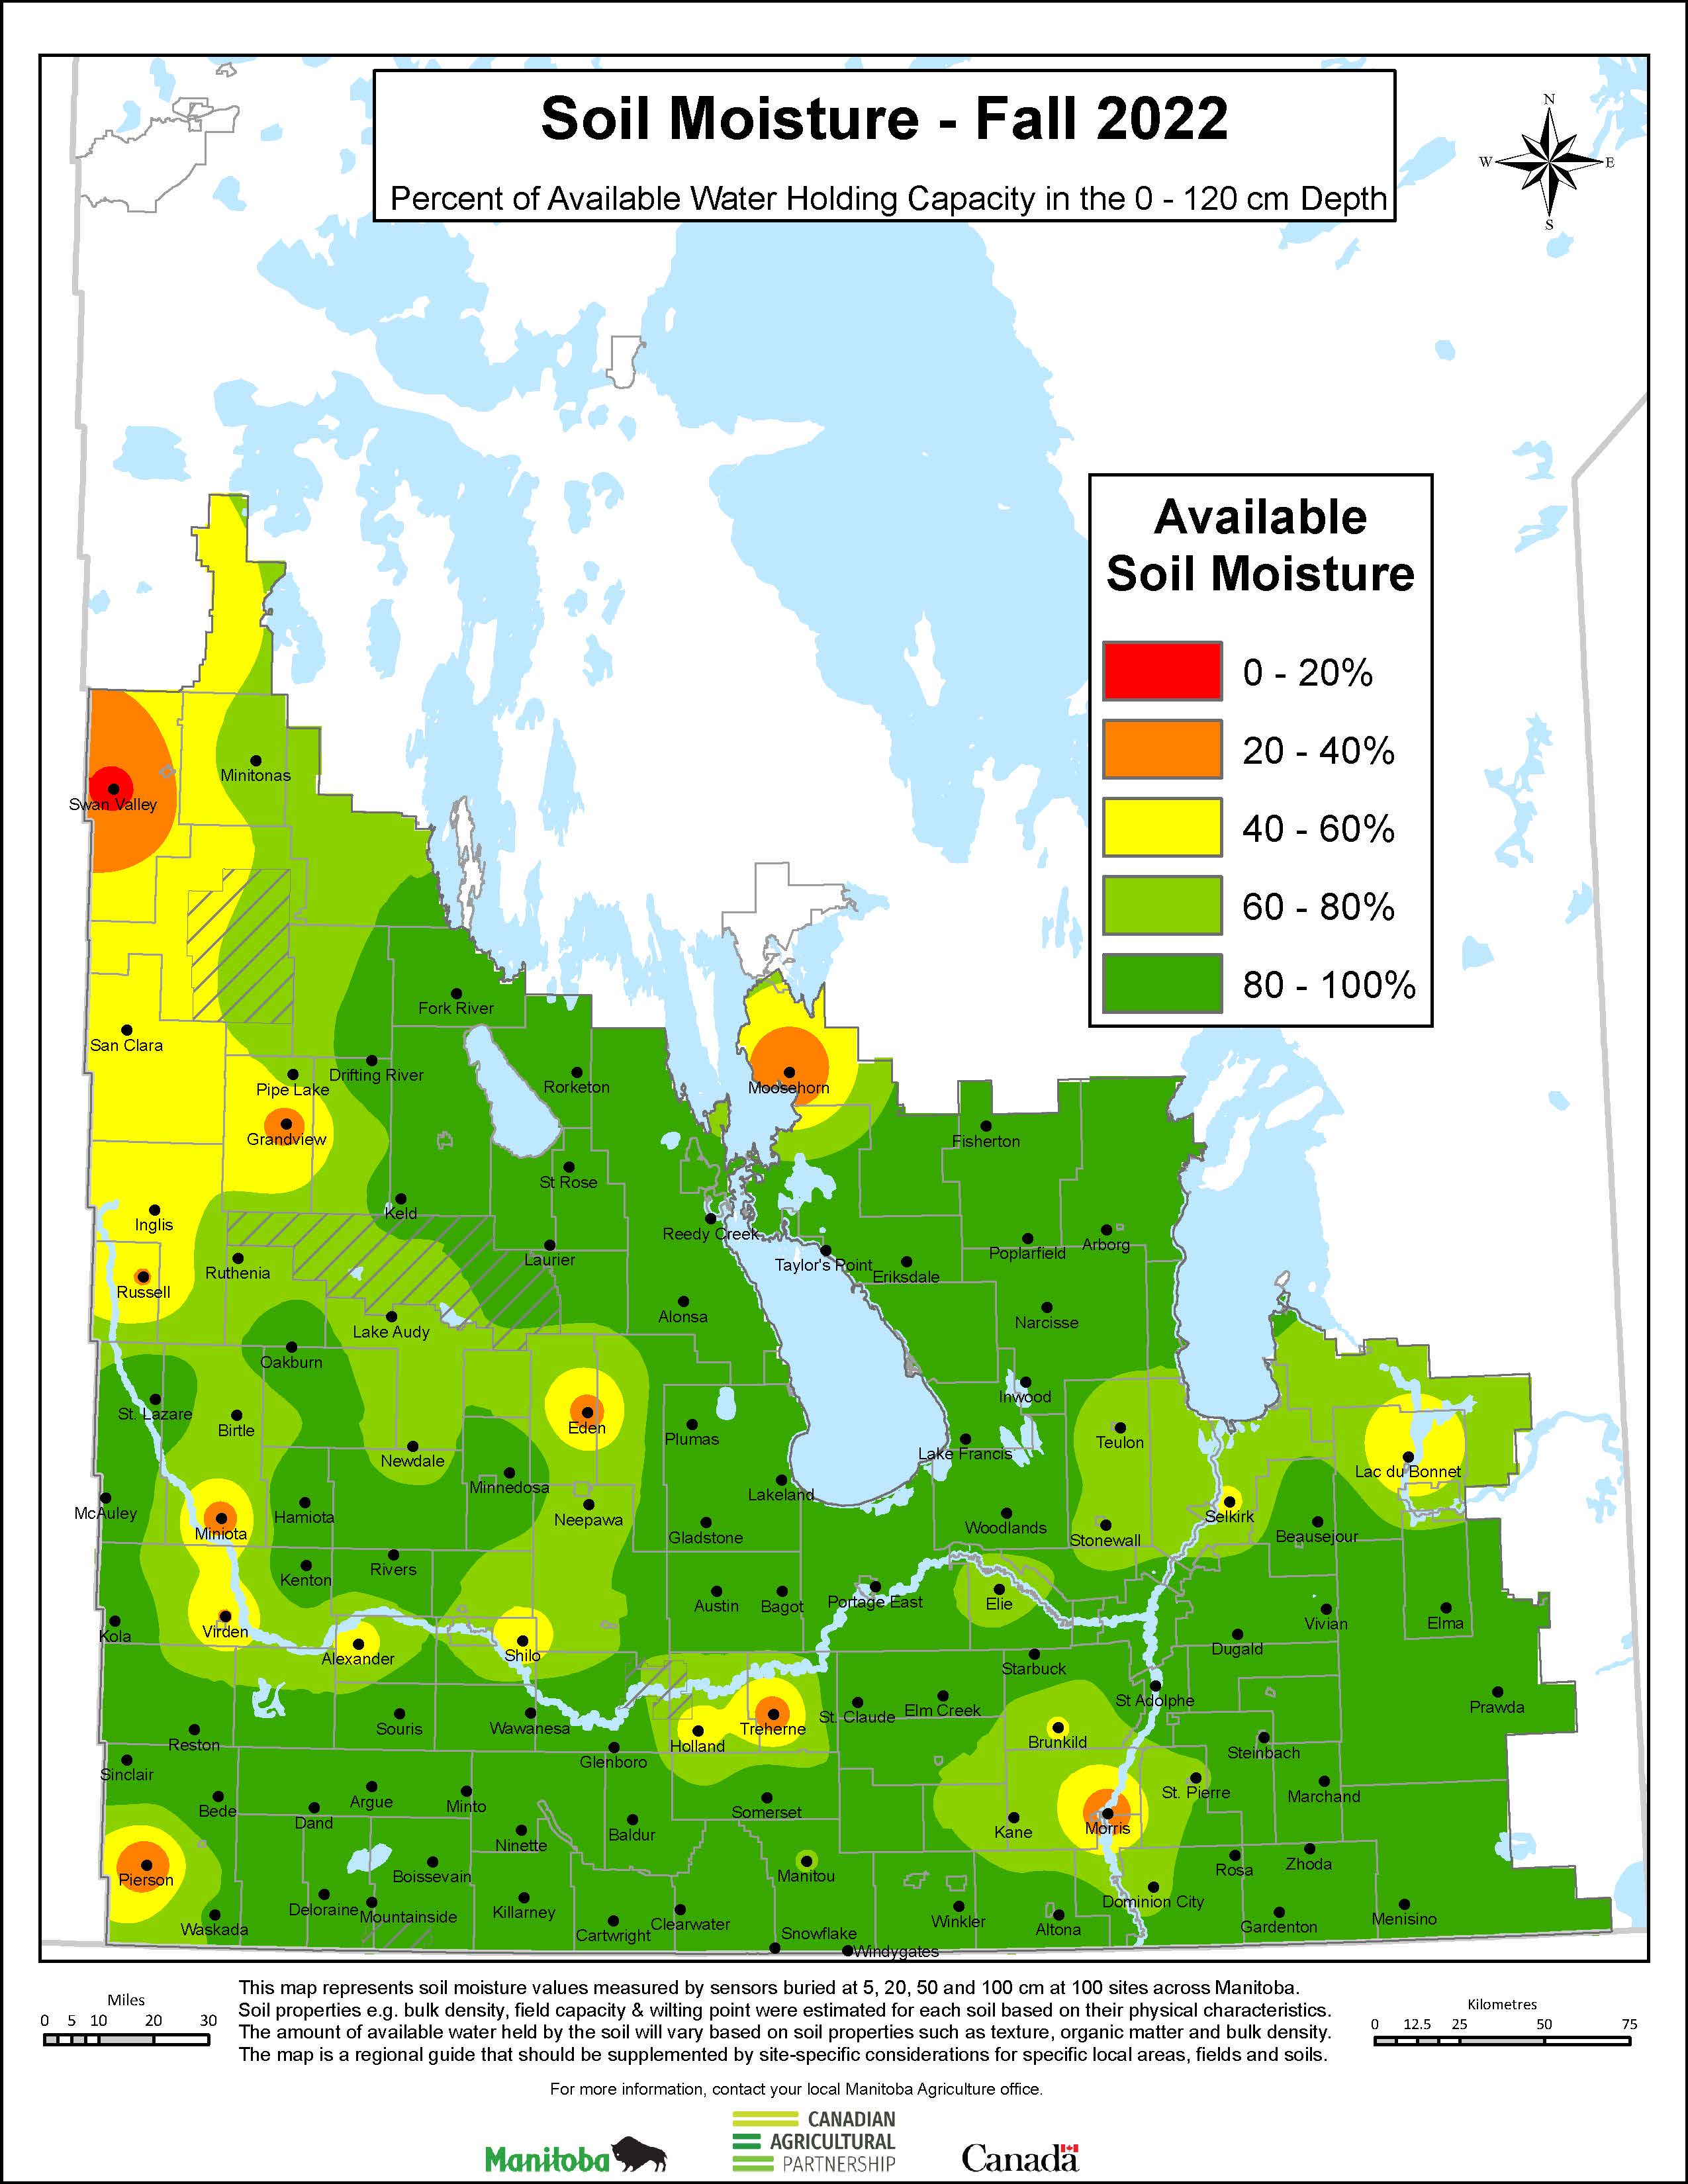
| Percent Available Soil Moisture | 2025 | 2024 | 2023 | 2022 | 2021 | 2020 | 2019 | 2018 | 2017 | 2016 | 2015 |
| Percent of Available Water Holding Capacity in the Root Zone (0 to 120cm) | view | view | view | view | view | view | view | view | view | view | view |
| Percent of Available Water Holding Capacity in the Top Zone (0 to 30cm) | view | view | view | view | view | view | view | view | view | view | view |
| Percent of Available Water Holding Capacity in the Sub Zone (30 to 120cm) | view | view | view | view | view | view | view | view | view | view | view |
Please note, there was no survey conducted in 2010 .