Provincial Respiratory Surveillance Report
COVID-19
This report provides a current epidemiological update on the intensity and severity of COVID-19 in Manitoba. Surveillance and administrative data include laboratory, hospitalization and mortality data. Data are presented at the provincial and regional level. In this weekly report, we provide regular updates about the current activity of COVID-19 in Manitoba with a focus on severe outcomes (hospital admissions, intensive care unit admissions (ICU), and deaths).
Data are reported with a one-week delay for increased data accuracy, completeness and reliability. Updates or changes to this report occur regularly. It is published online at approximately 10:00am every Thursday.
Week 13 (March 27 – April 2)
Data extracted up to 1:00 am on April 5, 2022
Next reporting date: April 14, 2022
|
|
|||||||||
|
|
|||||||||
|
Important Notes
|
||||||||||
Cases
Figure 1. Cases of COVID-19 by Week of Public Health Report Date, Manitoba, August 23, 2020 – April 2, 2022
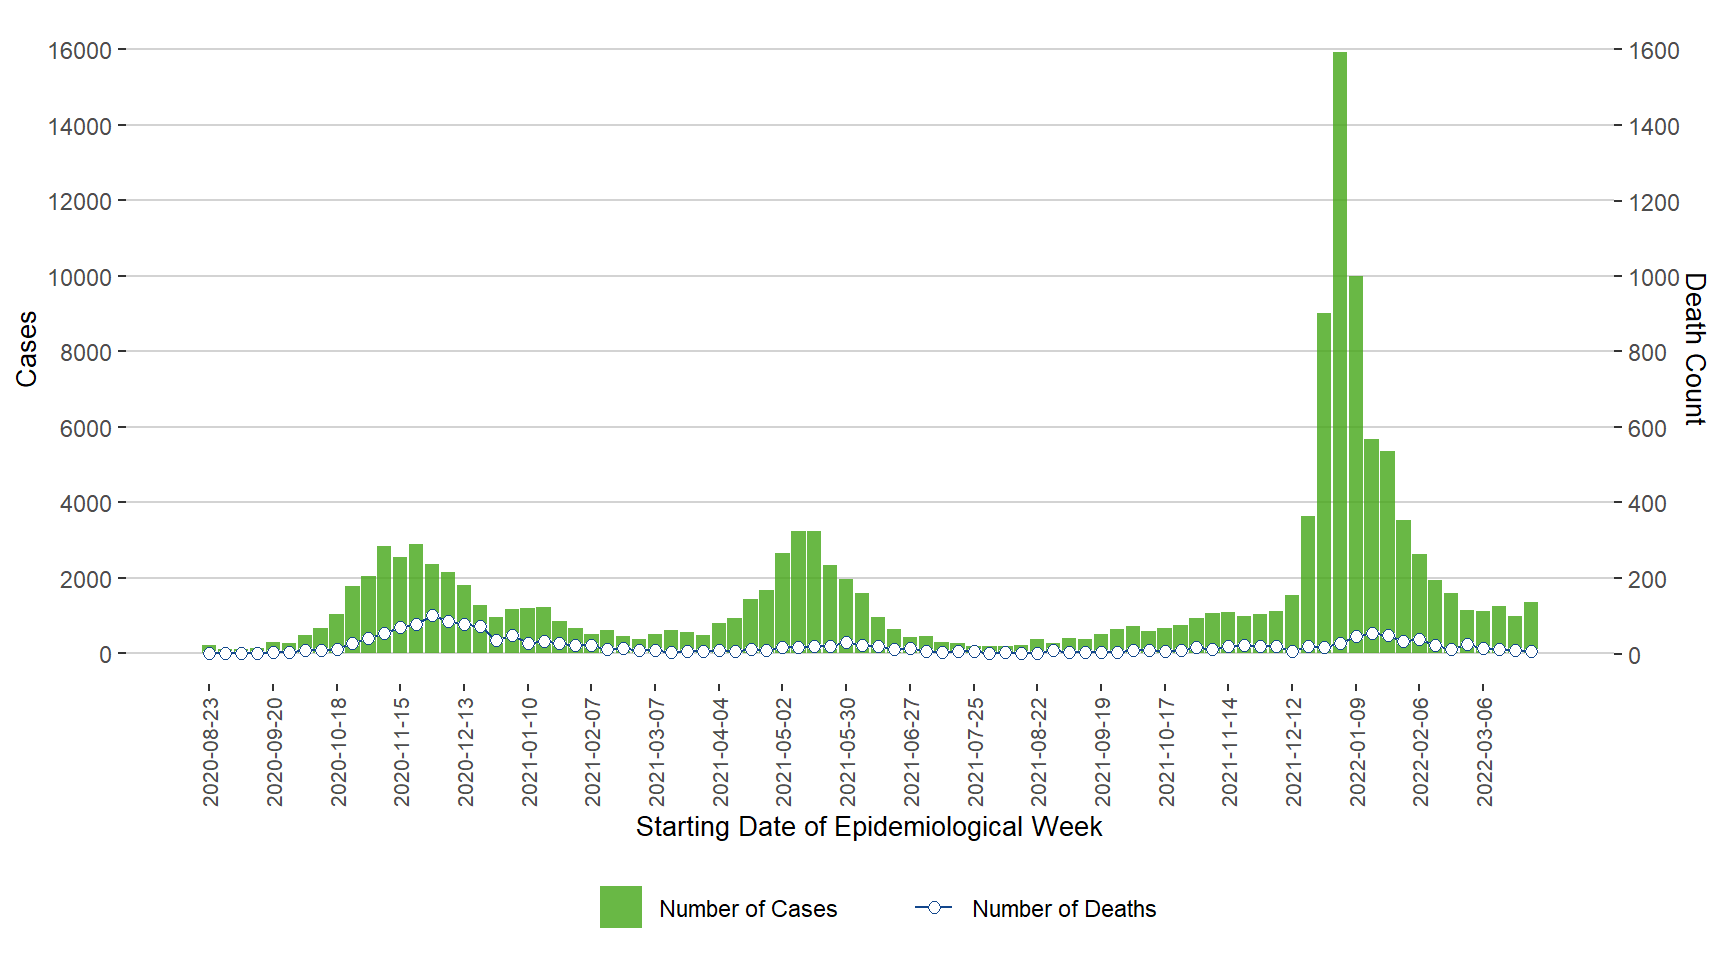
Weekly cases and deaths (.csv)
Note. Deaths due to COVID-19 were aligned by week of outcome date.
Figure 2. Sex and Age Distribution of COVID-19 Cases, March 1, 2020 – April 2, 2022
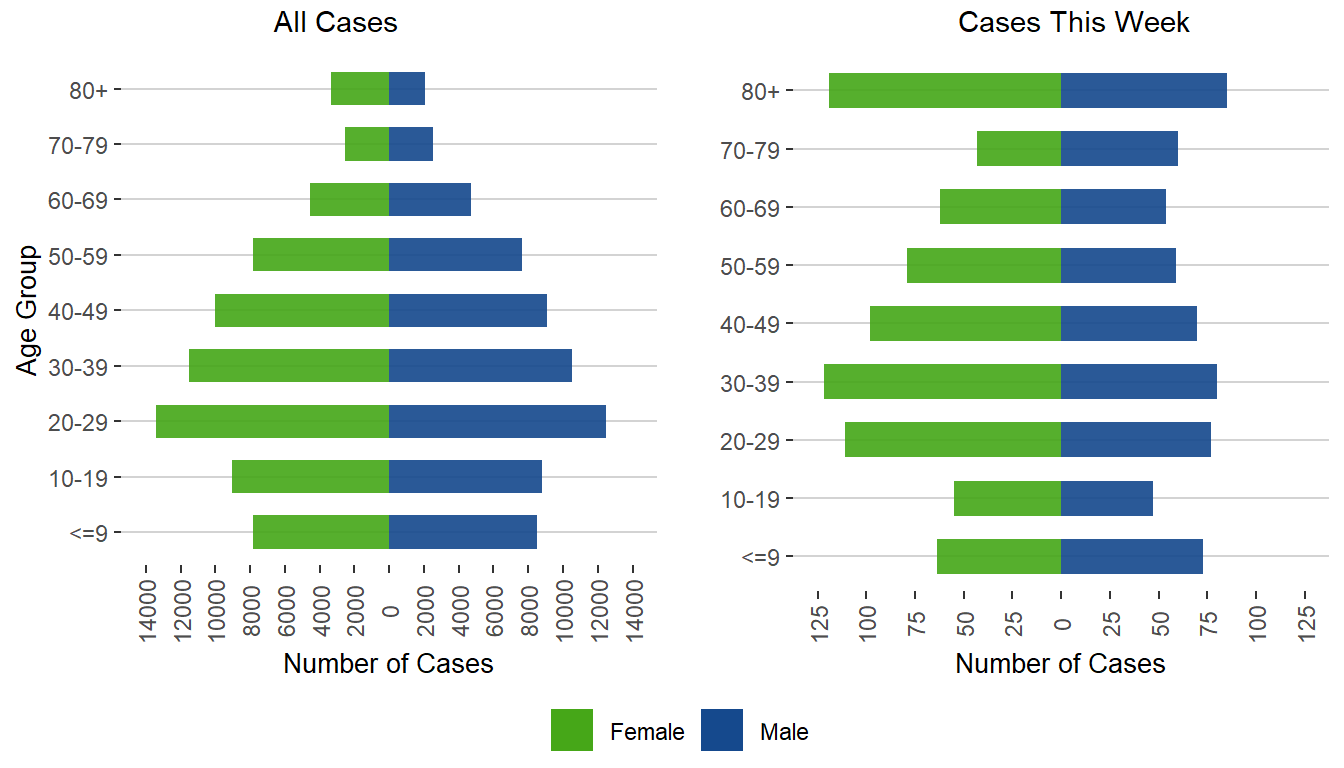
Figure 3. Incidence Rate (/10,000 Population) of COVID-19 Cases by Age Group and Week of Public Health Report Date, Manitoba, August 23, 2020 – April 2, 2022
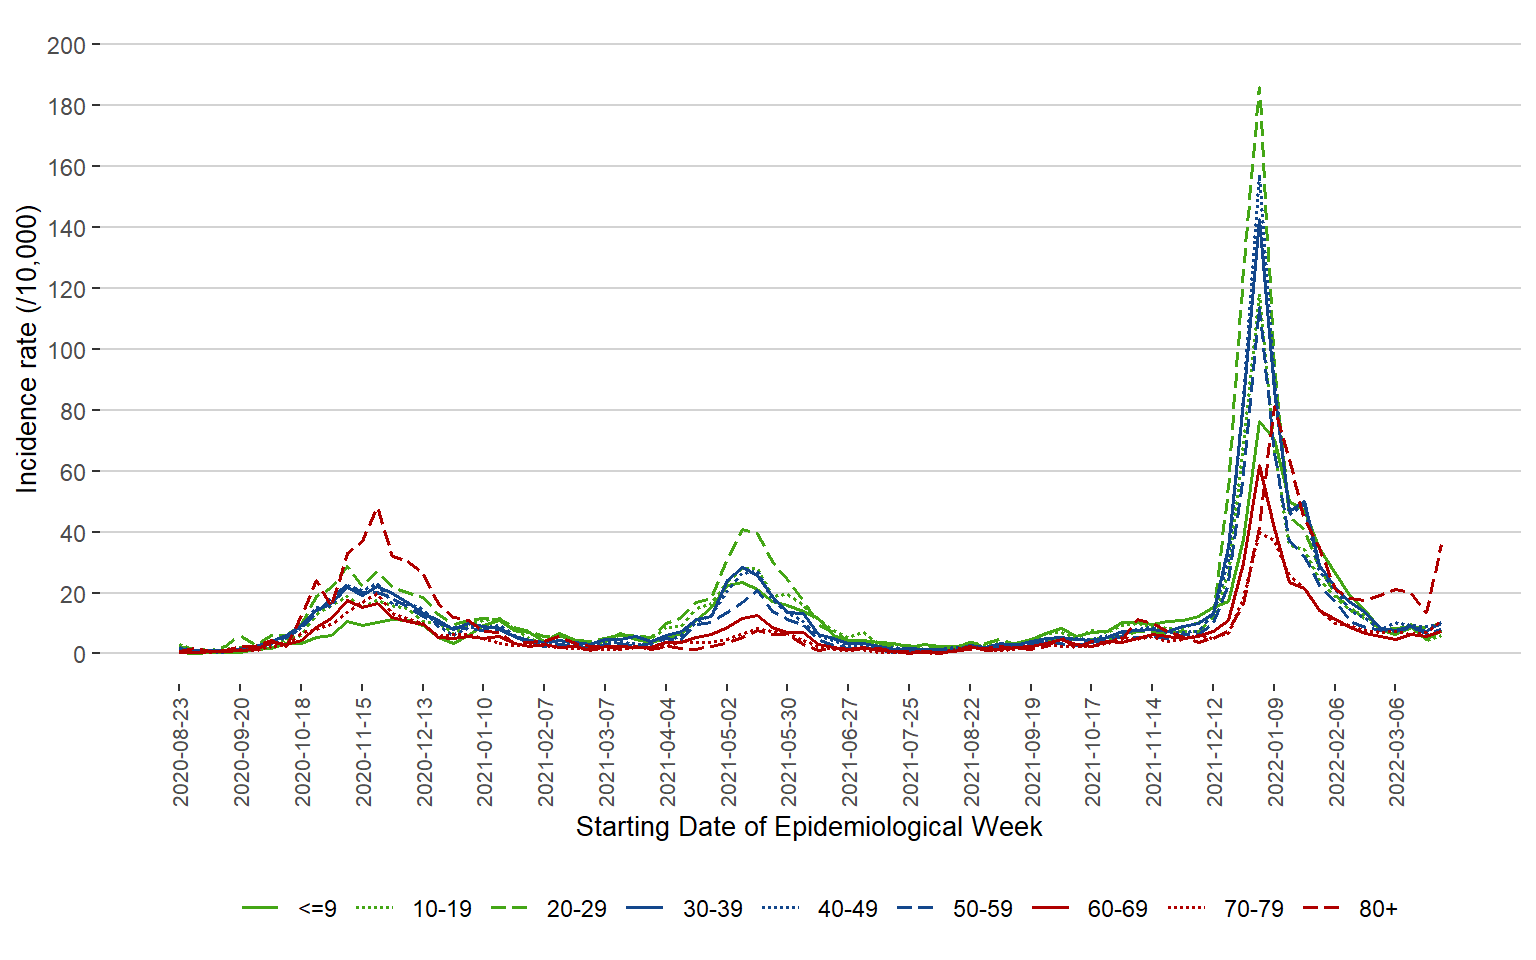
Weekly incidence rate by age (.csv)
Figure 4. Cases of COVID-19 by Health Region and Public Health Report Date, Manitoba, May 1, 2021 – April 2, 2022
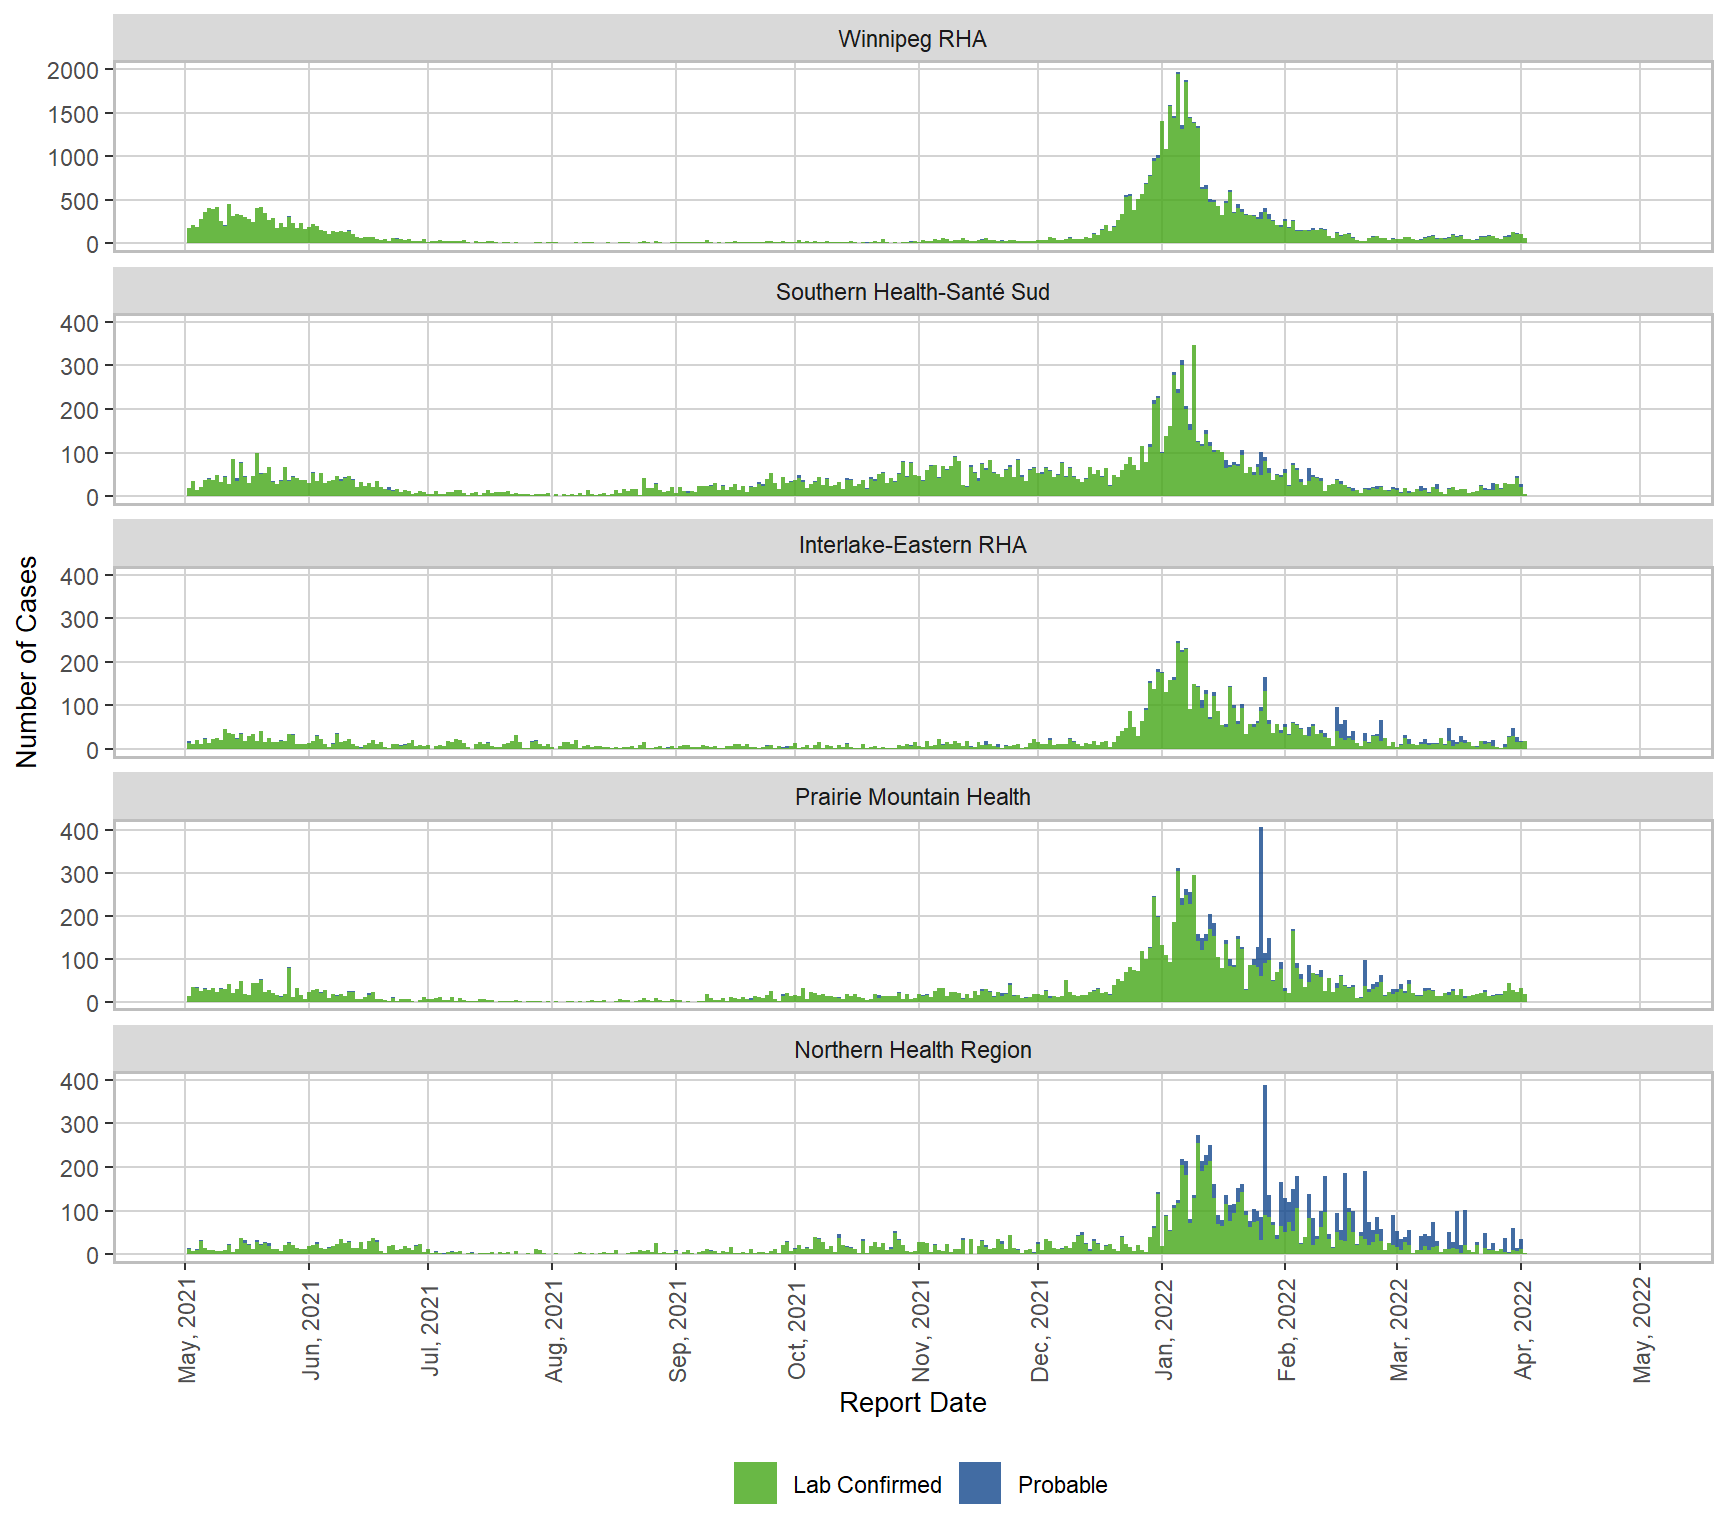
Table 1. Cases of COVID-19 and Incidence Rate (/10,000 population) by Health Region, Manitoba, March 13, 2020 – April 2, 2022
| Health Region | Total Cases | Cases this week | Incidence Rate | Age-standardized Incidence Rate * |
|---|---|---|---|---|
| Winnipeg RHA | 74,142 | 670 | 8.5 | 8.3 |
| Southern Health-Santé Sud | 19,207 | 185 | 8.7 | 9.1 |
| Interlake-Eastern RHA | 11,338 | 155 | 11.6 | 12.1 |
| Prairie Mountain Health | 13,797 | 183 | 10.6 | 9.7 |
| Northern Health Region | 18,089 | 166 | 21.5 | 21.1 |
Note: * Age-standardized rates are used to account for differences in the age structure in health regions. The whole Manitoba population is used as the standard population.
Figure 5. Vaccination Status in Monthly Hospital Admissions, ICU Admissions, and Deaths, Manitoba, March 1, 2022 – March 31, 2022
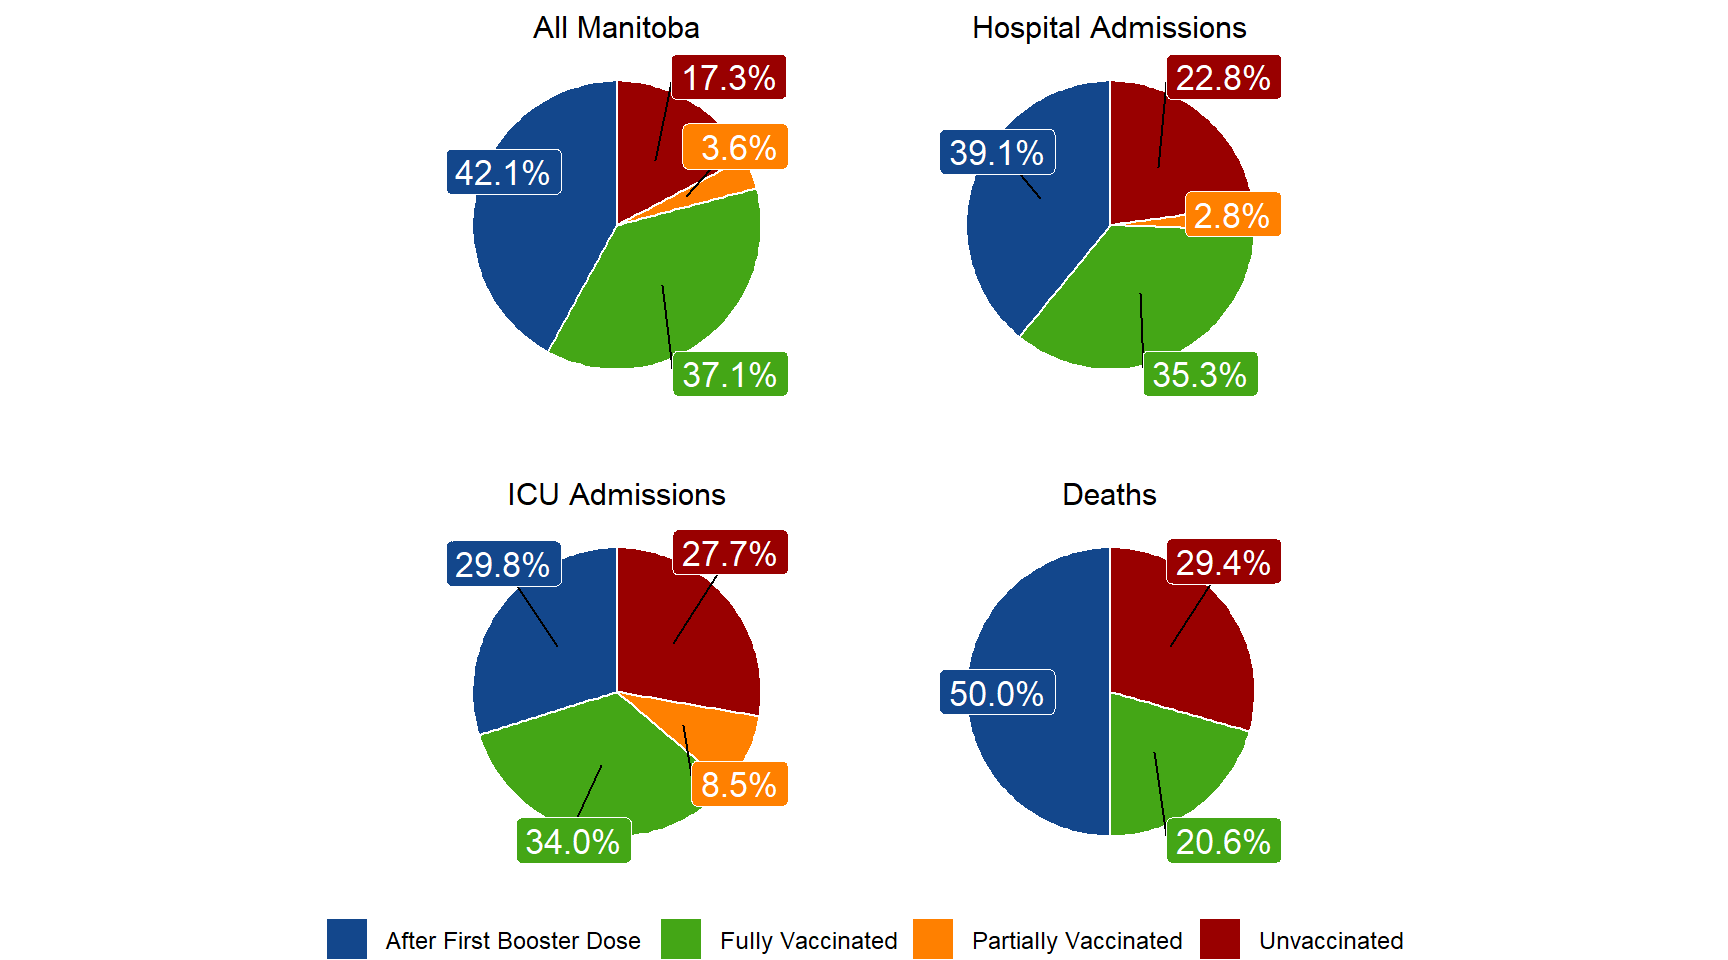
Note: Hospital admissions include ICU admissions. More
Unvaccinated Case: Individuals not vaccinated or vaccinated 0–13 days following the first dose of a COVID-19 vaccine. Partially Vaccinated Case: Individuals vaccinated >=14 days following the first dose of a 2-dose series COVID-19 vaccine if only one dose was received and 0-13 days following the second dose if two doses were received. Fully Vaccinated Case: Individuals vaccinated >=14 days following the second dose of a 2-dose series or first dose of a 1-dose series of a COVID-19 vaccine. After First Booster Dose: Individuals vaccinated >=14 days following one additional dose after completion of primary series.
Figure 6. Age-Standardized Rate (/100,000 person days) and Risk of Severe Outcomes Associated with COVID-19 Manitoba, March 1, 2022 – March 31, 2022
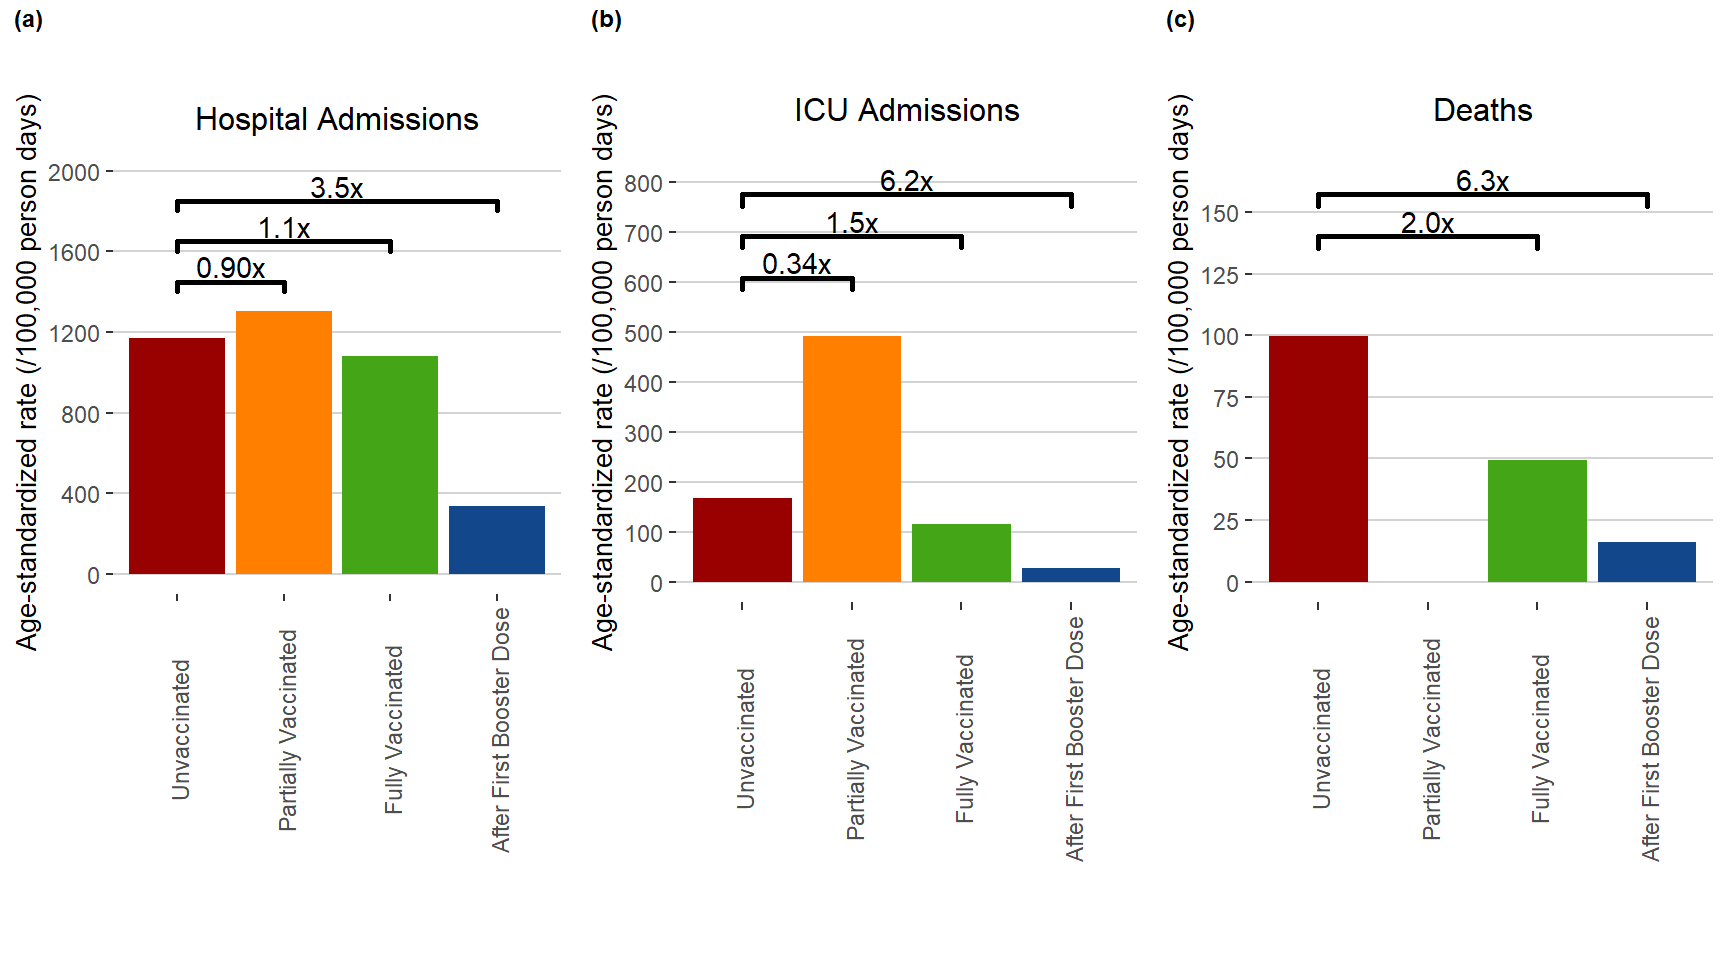
Note: Hospital admissions include ICU admissions. More
Table 2. Severe COVID-19 Cases After Infection, Manitoba, December 16, 2020 – April 2, 2022
| Partially vaccinated | % | Fully vaccinated | % | After First Booster Dose | % | |
|---|---|---|---|---|---|---|
| Hospital Admissions | ||||||
| 5-11 | 11 | 2.4% | 3 | 0.1% | 0 | 0.0% |
| 12-19 | 9 | 2.0% | 110 | 5.0% | 4 | 0.5% |
| 20-29 | 37 | 8.1% | 283 | 12.7% | 23 | 2.7% |
| 30-39 | 55 | 12.1% | 276 | 12.4% | 51 | 5.9% |
| 40-49 | 30 | 6.6% | 203 | 9.1% | 62 | 7.2% |
| 50-59 | 79 | 17.4% | 254 | 11.4% | 80 | 9.3% |
| 60-69 | 90 | 19.8% | 341 | 15.4% | 158 | 18.4% |
| 70+ | 144 | 31.6% | 750 | 33.8% | 480 | 55.9% |
| Total hospitalizations | 455 | 100% | 2,220 | 100% | 858 | 100% |
| ICU Admissions | ||||||
| 5-11 | 1 | 1.4% | 0 | 0.0% | 0 | 0.0% |
| 12-19 | 1 | 1.4% | 3 | 1.7% | 1 | 1.7% |
| 20-29 | 1 | 1.4% | 12 | 6.7% | 1 | 1.7% |
| 30-39 | 4 | 5.4% | 12 | 6.7% | 2 | 3.3% |
| 40-49 | 3 | 4.1% | 26 | 14.6% | 9 | 15.0% |
| 50-59 | 19 | 25.7% | 36 | 20.2% | 7 | 11.7% |
| 60-69 | 24 | 32.4% | 49 | 27.5% | 17 | 28.3% |
| 70+ | 21 | 28.4% | 40 | 22.5% | 23 | 38.3% |
| Total ICU admissions | 74 | 100% | 178 | 100% | 60 | 100% |
| Deaths | ||||||
| 12-19 | 0 | 0.0% | 0 | 0.0% | 0 | 0.0% |
| 20-29 | 1 | 1.6% | 2 | 1.0% | 0 | 0.0% |
| 30-39 | 1 | 1.6% | 1 | 0.5% | 0 | 0.0% |
| 40-49 | 0 | 0.0% | 6 | 2.9% | 2 | 1.7% |
| 50-59 | 14 | 21.9% | 20 | 9.7% | 3 | 2.5% |
| 60-69 | 15 | 23.4% | 40 | 19.4% | 14 | 11.9% |
| 70+ | 33 | 51.6% | 137 | 66.5% | 99 | 83.9% |
| Total deaths | 64 | 100% | 206 | 100% | 118 | 100% |
Note: Hospital admissions include ICU admissions.
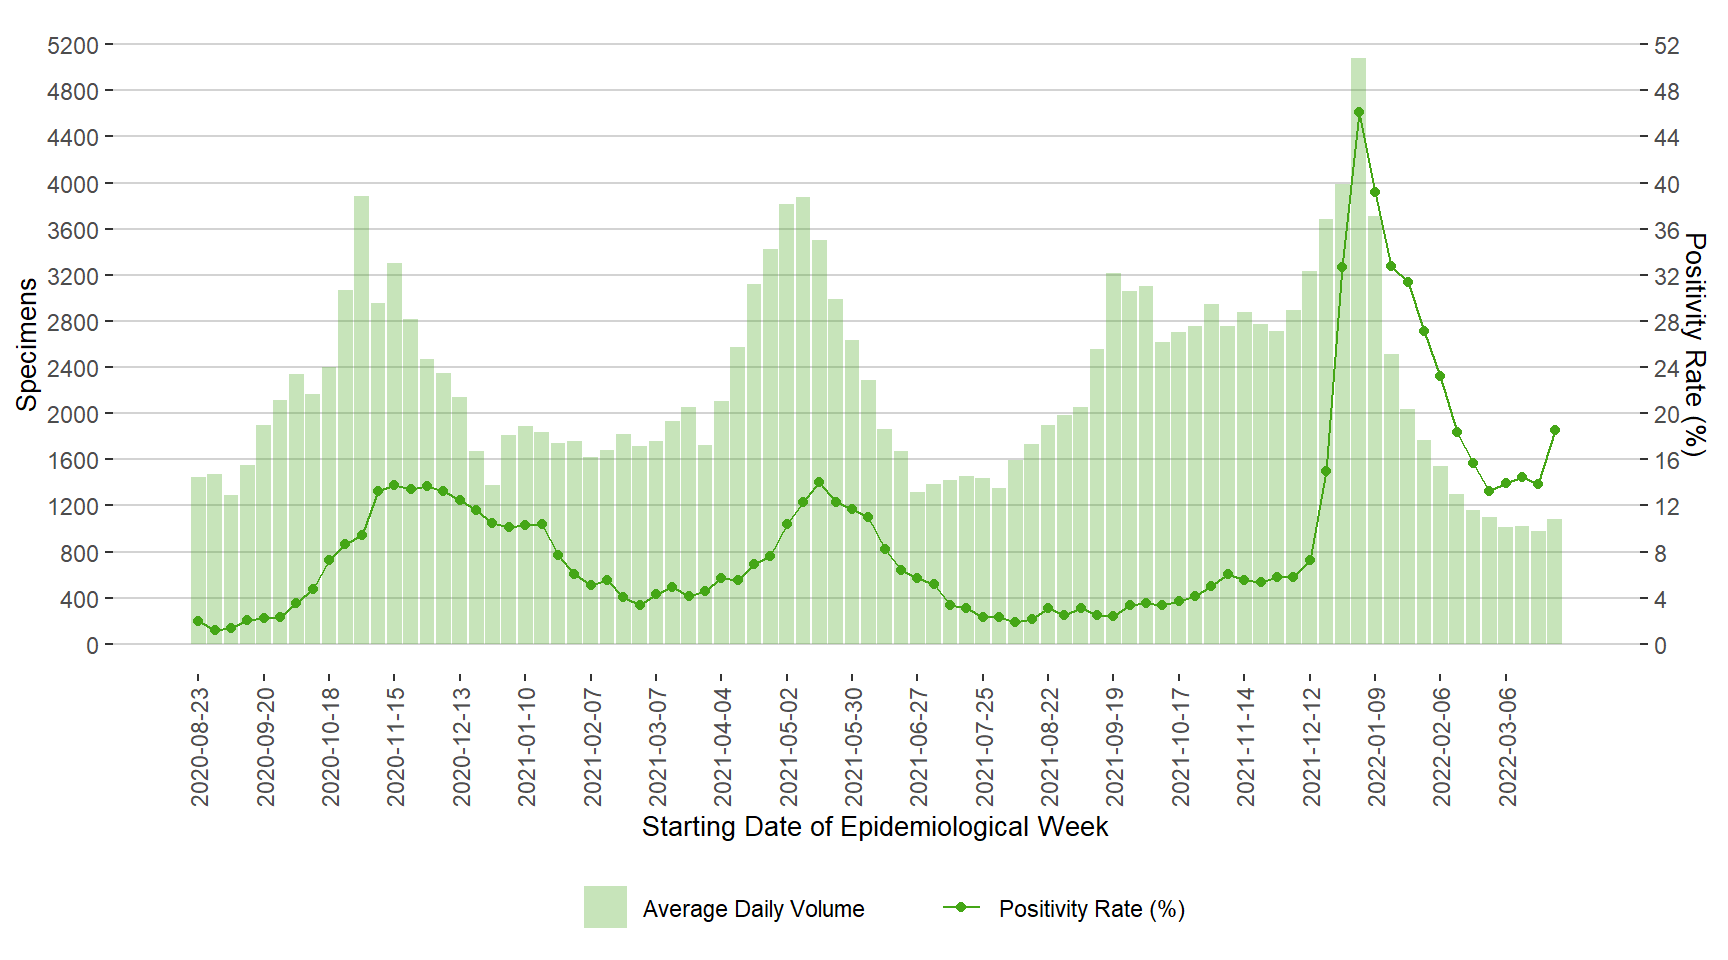
Testing
Figure 7. Average Daily Testing Volume and Positivity (%) for COVID-19 by Week of Specimen Receiving Date, Manitoba, August 23, 2020 – April 2, 2022
Severity
Figure 8. Severe Outcomes of COVID-19 by Week of Outcome Date, Manitoba, August 23, 2020 – April 2, 2022
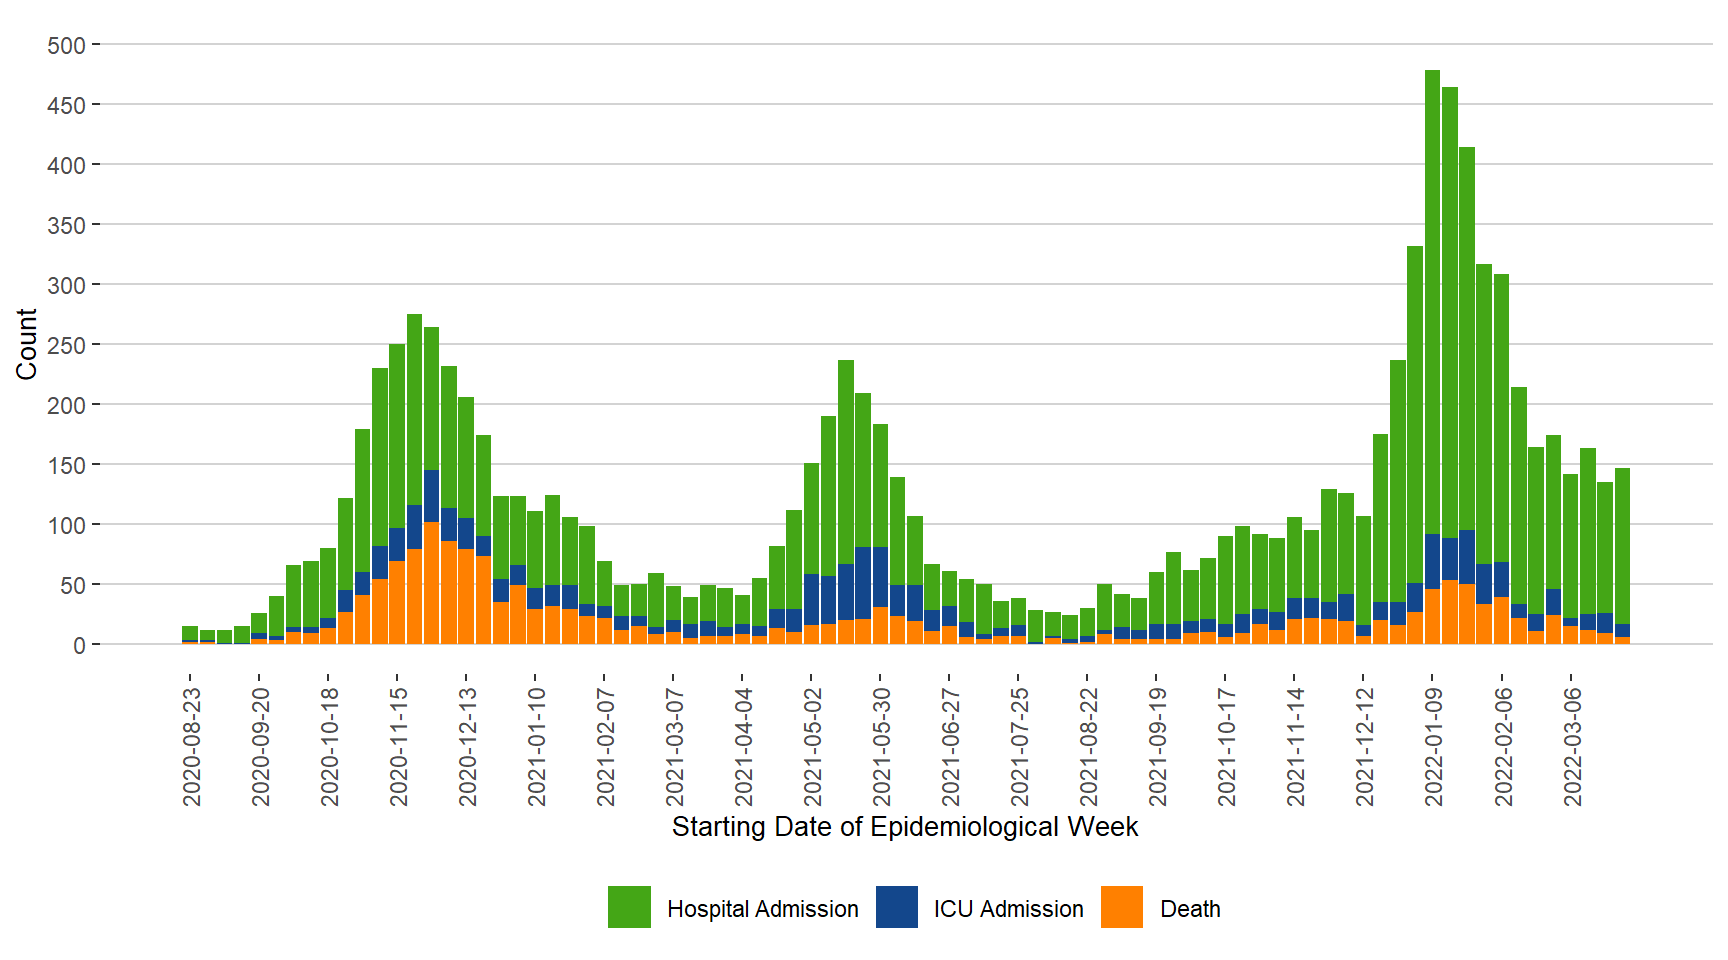
Note. ICU admissions are not included in the hospital admissions.
Figure 9. Age Distribution of Severe COVID-19 Cases Compared to All Cases, Manitoba, March 13, 2020 – April 2, 2022
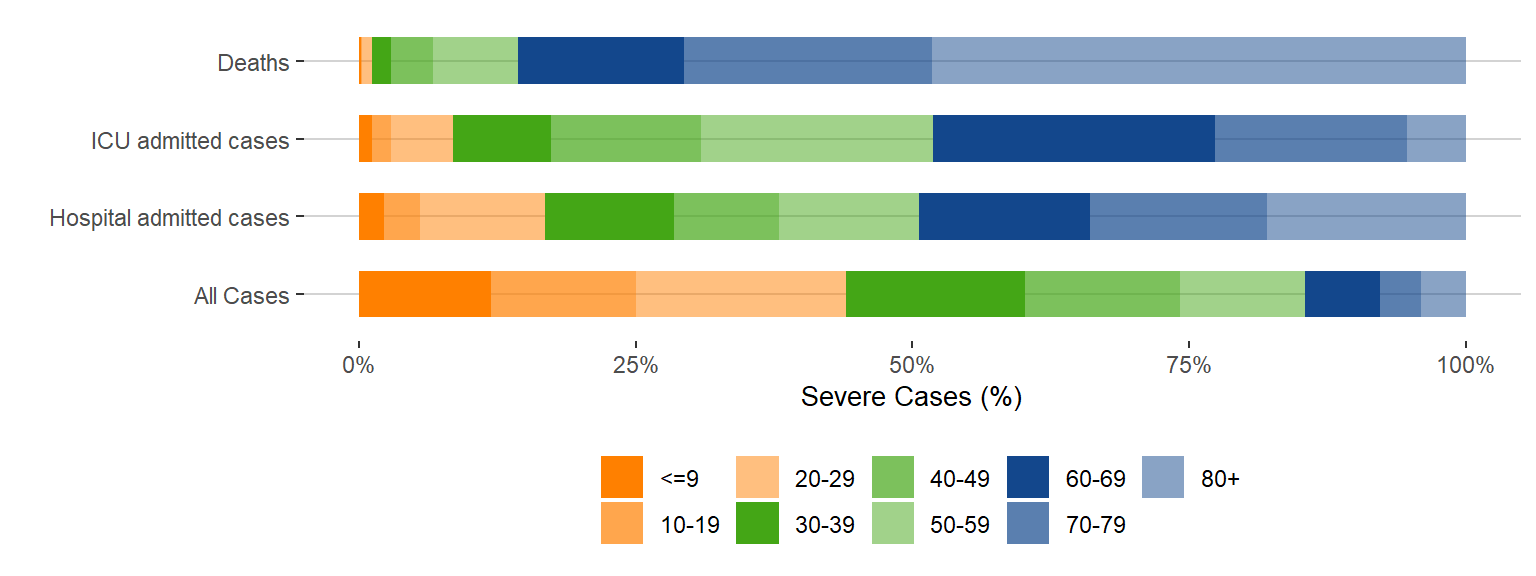
Age distribution of severe outcomes (.csv)
Figure 10. Percentage of COVID-19 Cases With Underlying Illnesses, Manitoba, March 13, 2020 – April 2, 2022
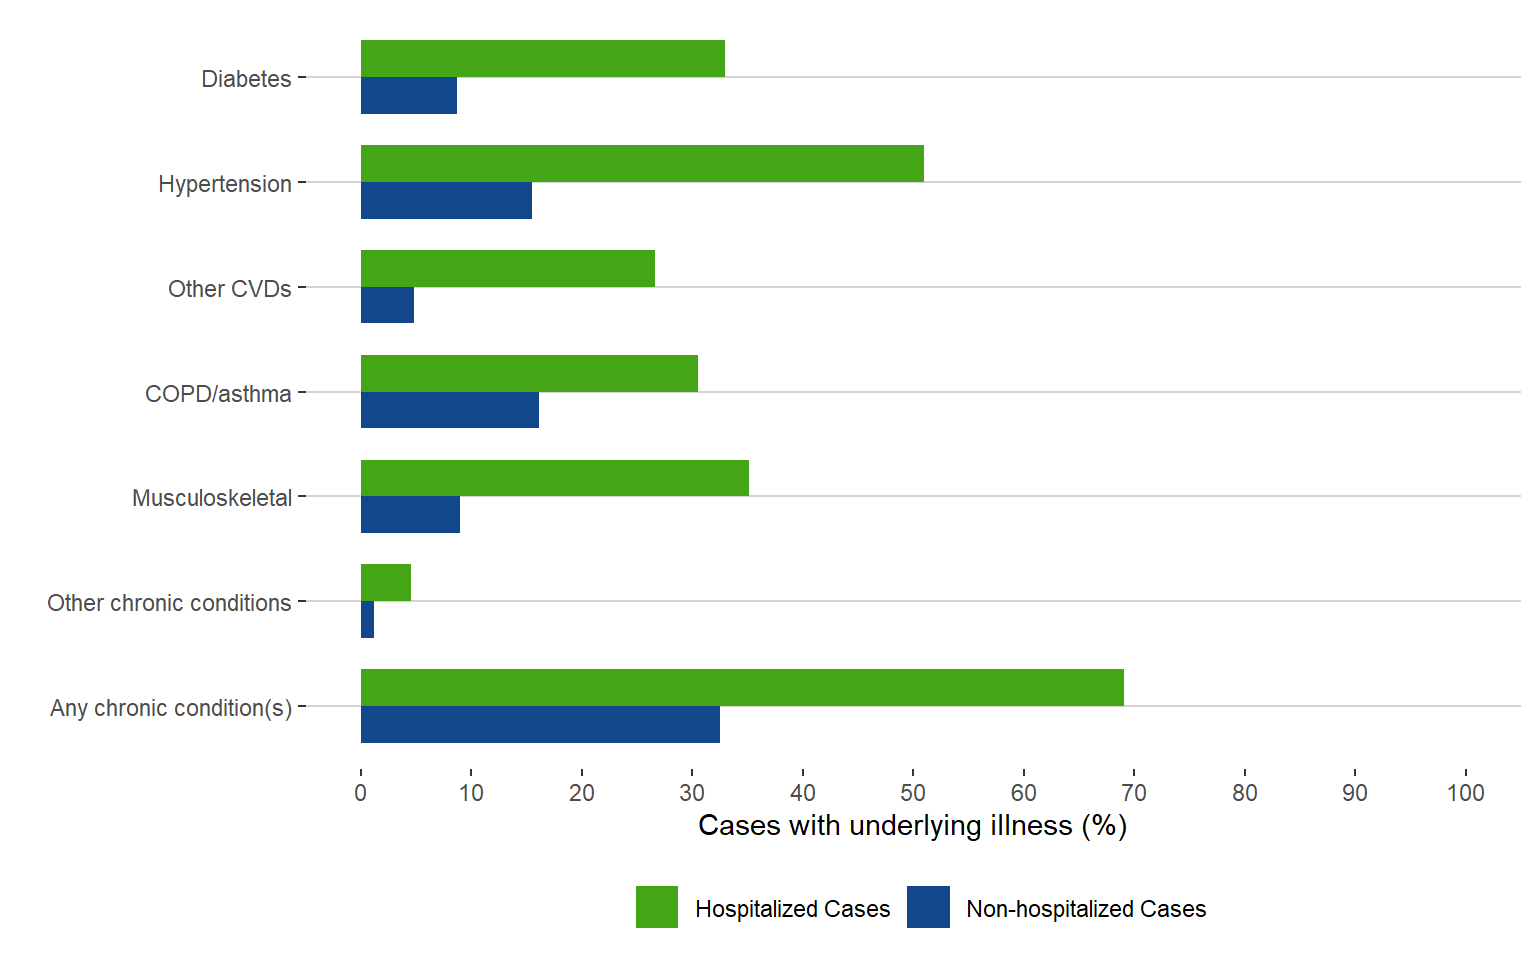
Note. Musculoskeletal illnesses include: osteoporosis, osteoarthritis, juvenile idiopathic arthritis, gout and crystal Arthropathies; COPD-chronic obstructive pulmonary disease; CVD-cardiovascular disease; Other CVDs include: ischemic heart disease, heart failure, acute myocardial infarction, and stroke; Other chronic conditions include: parkinson’s disease, multiple sclerosis, alzheimer’s disease and epilepsy. About definitions of chronic conditions
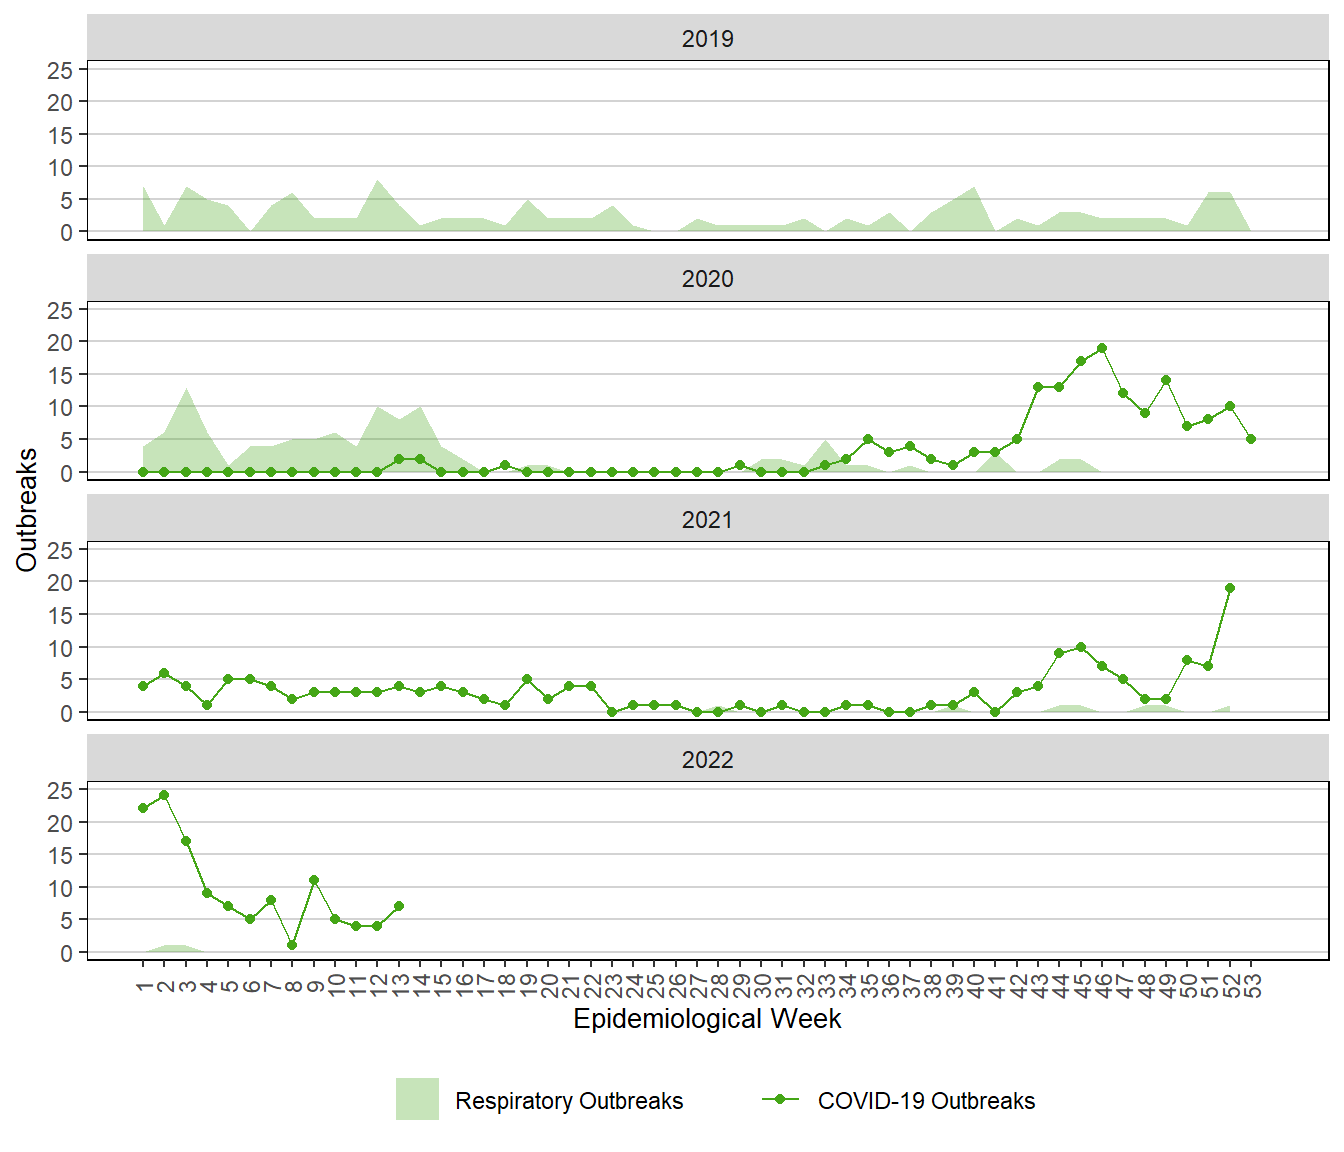
Outbreaks
Figure 11. Weekly COVID-19 Outbreaks, Manitoba, 2018 – 2022