Soil Management Guide
Using Soil Survey Information
- What is soil survey?
- What are soil survey reports?
- Why is map scale important?
- Why are detailed soil survey reports required for in-field assessments?
- Options for data collection when detailed soil survey information is unavailable
- Interpretive maps
- Agriculture capability for Manitoba
- How does agriculture capability compare to the crop insurance Soil Productivity Index ratings?
- Irrigation suitability
- Soil suitability for irrigated potato production
- Other assessment ratings
- Provincial soil concept
What is soil survey?
| Soil survey is an inventory of the properties of the soil (such as texture, internal drainage, parent material, depth to groundwater, topography, degree of erosion, stoniness, pH, and salinity) and their spatial distribution over a landscape (often portrayed in a map). Soils are grouped into similar types and their boundaries are delineated on a map. Each soil type has a unique set of physical, chemical and mineralogical characteristics and has similar reactions to use and management. The information assembled in a soil survey can be used to determine potential uses and limitations of the soils. As such, soil surveys can be used to plan the development of new lands or to evaluate the conversion of land to new uses. Soil surveys also provide insight into the kind and intensity of land management that will be needed. | 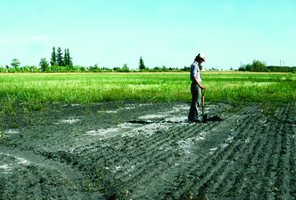 |
Figure 2.1 A soil surveyor inspecting a saline area |
What are soil survey reports?
A soil survey describes the characteristics of the soils in a given area, classifies the soils according to a standard system of classification, plots the boundaries of the soils on a map, and makes predictions about the behavior of soils. The different uses of the soils and how management affects them are considered in designing and carrying out the survey. The information collected in a soil survey helps in the development of land-use plans and evaluates and predicts the effects of land use on the environment (adapted from the USDA definition of “soil survey”). Soil survey reports contain two parts. The first component is a soils map or series of maps at a particular scale with coding for soil types. Soil survey reports also include a supporting document that contains background information, how the soil survey was conducted, an explanation of interpretive criteria and a summary of the area occupied by various soil types.
| Map Information Soil Polygon - an area (which can be of any shape) which contains a specific soil condition that is identified by a symbol(s). In addition to the limitations of map scale, the boundaries of the soil map polygons imply there are abrupt changes in soil types within the landscape. In reality, however, soil varies continuously across the landscape. It must be recognized that, although the map lines imply abrupt changes, the soil grades from one type to the next and the lines on the map are only approximations of where these transitions occur. Map Units - symbols on soil survey maps that represent the type of soil(s) found within a particular polygon. A simple map unit designates a single soil series on a detailed soils map. A complex map unit includes as many as three soil series on a detailed map, or as many as two soil associations on a reconnaissance soil map. Other information on the soil phase, such as extent of erosion, slope gradient, stoniness and salinity, may be included within the map unit. | 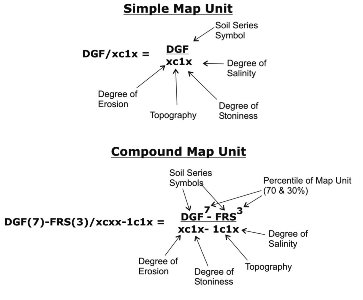 Figure 2.2 Derivation of map unit symbology |
Why is map scale important?
Reconnaissance (general) soil surveys of Manitoba were started in 1926 as the first step in the development of a basic program of soil research, education, conservation and utilization for the province. The scale of these maps is approximately 1:125,000, or 1/2 inch to 1 mile. In recent years, many developments have occurred in agriculture that have created demand for soils information that is beyond the scope of detail provided in reconnaissance surveys, such as:
- research trials
- manure application and nutrient management
- precision farming
- soil productivity for production insurance ratings
- land use planning
- suitability for irrigation and drainage
- tax assessment
- watershed management
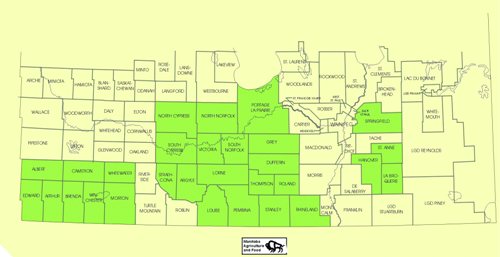 |
| Figure 2.3 Current availability of detailed soils information for complete rural municipalities of agro-Manitoba |
| Note: There are several municipalities in other parts of Manitoba that have a portion of their area surveyed at a detailed level. Many of these areas surround town sites and were conducted for the purpose of assessing soil suitability for sewage lagoons. Please refer to Manitoba Agri-Maps to access soil survey information for agro-Manitoba. |
The first large-scale, or detailed, soil survey in Manitoba was published in 1972 for the Portage la Prairie area at a scale of 1:20,000. Detailed soil surveys identify more of the variation in soil types across smaller landscapes (Figure 2.4). Detailed soil survey maps are much more accurate and reliable for making decisions at the farm-level (Table 2.1). Field inspection sites for a 1:20,000 map scale (3.2 inches to 1 mile) requires 25-30 inspection sites per section of land (Figure 2.5). Semi-detailed maps at 1:50,000 scale, or 1.5 inches to 1 mile, require 16 inspections per section. A two-person crew usually maps one section per day. Mapping costs are approximately $3.00-7.50/acre, but this is a one-time cost, as most soil properties remain unchanged over a lifetime.
Table 2.1 Intended uses for maps according to scale
| Generalized 1:100,000 | Reconnaissance 1:125,000 | Detailed 1:50,000 | Detailed 1:20,000 |
| Provincial overview | General soils awareness | On-farm decisions Municipal decisions | On-farm decisions Municipal decisions |
| N/A | ~ 6 inspections per section | ~ 16 inspections per section | ~ 30 inspections per section |
| General soil comparisons (soil orders) National scope | General soil comparisons (subgroup/family/ association level) National scope Starting point for more detailed soils data collection | Field scale comparisons (series level) Watershed management Land use assessment | Field scale comparisons (phase level) Precision agriculture Irrigation assessment Potato suitability Nutrient management Land use assessment |
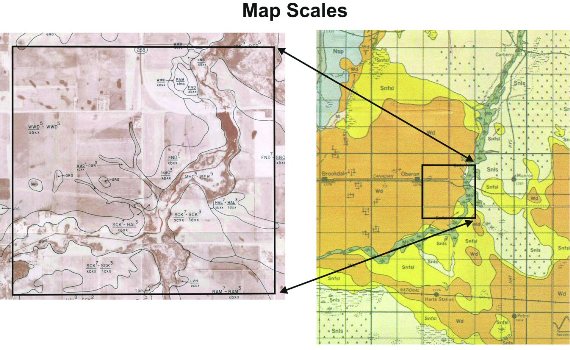 |
| Figure 2.4 Comparison of soils information on same land parcel at detailed (1:20,000) scale (left) versus reconnaissance (1:126,720) scale (right) |
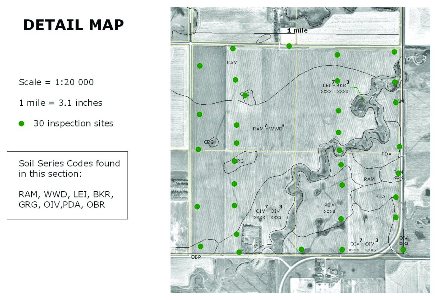 |
| Figure 2.5 Typical soil sampling and inspection pattern for a detailed soil survey |
Why are detailed soil survey reports required for in-field assessments?
Soil survey maps are not without limitations. Although the map may say that a discrete area of land contains a certain soil type, it must be understood that the reliability of that information is a function of the map scale. All soil delineations (called polygons) contain small areas of dissimilar soils that are not identified (called inclusions). The smaller the scale of the map (or the more general the map), the more frequently this occurs. Small-scale, reconnaissance or general soil surveys give only a broad picture of the dominant types and distribution of soils that occur over relatively large areas. The landscape may actually include fairly significant areas of different soils that are not identified on the map. As such, reconnaissance soil surveys are best suited to making general comparisons of soil capabilities and limitations on a regional, national or even worldwide scale. They are not reliable for making on-farm decisions as they lack the detail necessary to describe the variation in the soil types on the farm (Table 2.1). Recent translation of soils information in reconnaissance areas into digital maps and an interpretive data base (eg. as agriculture capability) looks like detailed soil series information. However, this data has not been verified by field inspections to the same extent as detailed soil surveys. As a result, these maps are not as reliable at the farm level as detailed soil survey information. This data should only be used for general soils information purposes or coupled with detailed soils data from field visits; it should not be relied on solely for on-farm decisions.
Options for data collection when detailed soil survey information is unavailable
When detailed soil survey data is needed but unavailable, on-site investigations are necessary. On-farm soil survey can be designed for a specific purpose or general purpose. A specific, or single purpose survey may be appropriate when there is only one, well-defined objective (such as siting a livestock operation). In this instance, only the information required to meet the single objective may need to be collected. The major advantage to a single purpose survey is decreased cost. A general-purpose survey, on the other hand, contains a wider range of information. Although more information is more costly to collect, the general-purpose soil survey may have more value over the long-term as it can be interpreted in a variety of ways and can be reused for many purposes.
As detailed soils information is not available in all parts of Manitoba, some information about the soil types present in the landscape can be gleaned from aerial photos, yield maps, infrared maps, etc. Coupled with the landowners’ knowledge of the area, several interpretations can be made:
- Scale and acreage determination
- Identify major features such as roads, rail lines and yard sites
- Identify soil features such as knolls, depressions and saline areas
- Using personal experience, yield maps or strip trial data, locate crop features (i.e. Where are best yields, poorest yields usually found?)
- What management decisions can be made? Or is more information needed? Is a field investigation warranted?
The reliability of the field data and its interpretation is largely dependent on the experience and ability of the surveyor. Data collection should always follow standardized procedures and should only be carried out by those who have received training in soil survey. An example of soil survey interpretation is the evaluation of a given land base for manure application. The type of soil and its associated characteristics determine the crops that can be grown, their yield potentials, the quantities of nutrients that are needed and the field practices that will be necessary to maintain optimum soil conditions for plant growth. As well, soil data on permeability (the rate at which water moves through a soil), depth to groundwater, flooding, slope gradient, soil texture and depth to bedrock can be useful in determining the risk of groundwater contamination due to leaching or surface water contamination due to runoff and erosion.
Interpretive maps
The following conceptual model depicts the information required to make on-farm land use and land management decisions that are objective, consistent and technically sound.
| Detailed Soils Info (Baseline Data) E.g. LOP/xcxx | + |
Standardized Interpretive Criteria E.g. agriculture capability - 4M | = |
Appropriate Land Use and Management E.g. most suitable for improved forage or pasture under dryland conditions |
Agricultural capability for Manitoba
Agriculture capability is a 7 class rating of mineral soils based on the severity of limitations for dryland farming. This system does not rate the productivity of the soil, but rather its capability to sustain agricultural crops based on limitations due to soil properties and landscape features and climate. This system is usually applied on a soil polygon basis and the individual soil series are assessed and maps portray the condition represented by the dominant soil in the polygon. Class 1 soils have no limitations, whereas Class 7 soils have such severe limitations that they are not suitable for agricultural purposes. In general, it takes about 2 acres (0.8 hectares) of Class 4 land to equal production from 1 acre (0.4 hectares) of prime (Class 1) land. (From Land: The Threatened Resource).
Class 1: Soils in this class have no important limitations for crop use. The soils have level to nearly level topography; they are deep, well to imperfectly drained and have moderate water holding capacity. The soils are naturally well supplied with plant nutrients, easily maintained in good tilth and fertility; soils are moderately high to high in productivity for a wide range of cereal and special crops (field crops).
Class 2: Soils in this class have moderate limitations that reduce the choice of crops or require moderate conservation practices. The soils have good water holding capacity and are either naturally well supplied with plant nutrients or are highly responsive to inputs of fertilizer. They are moderate to high in productivity for a fairly wide range of field crops. The limitations are not severe and good soil management and cropping practices can be applied without serious difficulty.
Class 3: Soils in this class have moderate limitations that restrict the range of crops or require moderate conservation practices. The limitations in Class 3 are more severe than those in Class 2 and conservation practices are more difficult to apply and maintain. The limitations affect the timing and ease of tillage, planting and harvesting, the choice of crops and maintenance of conservation practices. Under good management, these soils are fair to moderate in productivity for a fairly wide range of field crops.
Class 4: Soils in this class have significant limitations that restrict the choice of crops or require special conservation practices or both. These soils have such limitations that they are only suited for a few field crops, the yield for a range of crops may be low or the risk of crop failure is high. These soils are low to moderate in productivity for a narrow range of field crops but may have higher productivity for a specially adapted crop or perennial forage.
Class 5: Soils in this class have severe limitations that restrict their capability to producing perennial forage crops and improvement practices are feasible. These soils have such serious soil, climatic or other limitations that they are not capable of use for sustained production of annual field crops. However, they may be improved by the use of farm machinery for the production of native or tame species of perennial forage plants.
Class 6: Soils in this class are capable only of producing perennial forage crops and improvement practices are not feasible. Class 6 soils have some natural sustained grazing capacity for farm animals, but have such serious soil, climatic or other limitations as to make impractical the application of improvement practices that can be carried out on Class 5 soils. Soils may be placed in this class because their physical nature prevents the use of farm machinery or because the soils are not responsive to improvement practices.
Class 7: Soils in this class have no capability for arable culture or permanent pasture because of extremely severe limitations. Bodies of water too small to delineate on the map are included in this class. These soils may or may not have a high capability for forestry, wildlife and recreation.
Agriculture capability subclasses identify the soil properties or landscape conditions that may limit use. A capital letter immediately following the class number identifies the limitation (eg. 2W, 3N, etc.).
| Subclasses: | |
| C - | adverse climate (outside the boundaries of agro-Manitoba) |
| D - | dense soils (undesirable soil structure/low permeability) |
| E - | erosion damage |
| I - | inundation (flooding) by streams and lakes |
| M - | moisture (droughtiness) or low water holding capacity |
| N - | salinity |
| P - | stoniness |
| R - | consolidated bedrock |
| T - | topography (slopes) |
| W - | excess water other than flooding (inadequate soil drainage or high water table) |
| X - | two or more minor limitations |
How does agriculture capability compare to the crop insurance Soil Productivity Index ratings?
Crop insurance coverage is based on a 10-category classification system for cultivated land based on soil productivity as determined by crop yields. The ratings are from A to J with A being the most productive and J the least. Each quarter section receives a single rating and the ratings are calculated based on moving average cropping data, temperature, precipitation and soil factors such as organic matter, sub-surface material, texture, drainage, depth of topsoil, topography, salinity and erosion. Ratings are modified to account for local risk factors such as frequency of drought, frost, flooding and other natural hazards. As a result, a quarter section with several soil polygons will have several agriculture capability ratings, but will always have one soil productivity index rating.
Irrigation Suitability
Irrigation suitability is a general suitability rating for irrigated crop production. This classification system considers soil and landscape characteristics such as texture, drainage, depth to water table, salinity, geological uniformity, topography and stoniness and ranks them in terms of their sustained quality due to long term management under irrigation. It does not consider factors such as water application, water availability, water quality or economics of this type of land use. Classes are excellent, good, fair and poor.
Soil suitability for irrigated potato production
Deep, well-drained, sandy loam to loam soils exhibit favourable properties for the production of high quality potatoes. This rating is a 5-class evaluation of soil properties and landscape features that are important for irrigated production of potatoes for processing, with Class 1 soils most suitable and Class 5 soils least desirable for this use. Texture, drainage, salinity, sodicity, topography and stoniness are considered.
Other assessment ratings
Detailed soil survey reports include assessment criteria for several other non-agricultural uses that may be of value to engineers, land use planners and the general public. These suitability ratings include soil assessments for:
- source of top soil
- source of sand and gravel
- source of road fill
- permanent buildings with basements
- local roads and streets
- sanitary trench
- landfill area
- cover material
- sewage lagoon
- septic field
- playground
- picnic area
- camp area
- path and trails
- permanent buildings without basements
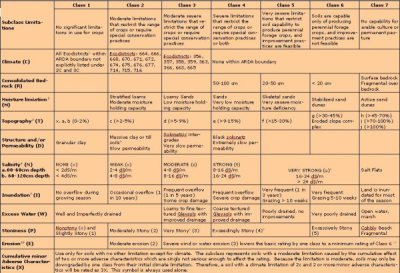
Table 2.2 Dryland agriculture capability guidelines for Manitoba
Based on the Canada Land Inventory Soil Capability Classification for Agriculture (1965, Rev. 2001), with modifications made for soil application at larger mapping scales.
Click table below to enlarge
- Smith, R.E., H. Veldhuis, G.F. Mills, R.G. Eilers, W.R. Fraser, M. Santry, 1996. Terrestrial Ecoregions and Ecodistricts of Manitoba, An Ecological Stratification of Manitoba’s Natural Landscapes. Agriculture and Agri-Food Canada, Research Branch, Brandon Research Centre, Manitoba Land Resource Unit, Winnipeg, MB. Report and Provincial Map at scale of 1:1.5m.
- With the exception of Class 2, ratings as indicated are based on the assumption of a single parent material, using the most readily drained representative of each textural class. Prevailing climatic conditions within the Ecodistrict, soil drainage and stratification will affect the moisture limitation accordingly.
- Topographic classes are based on the most limiting slope covering a significant portion of an area of complex, variable slopes. Map units with long, unidirectional slopes may be considered equivalent, or one class worse due to an increased erosion hazard.
- Extremely calcareous loamy till soils with a high bulk density (>1.7 g/cm3) are rated 3D.
- Soil Salinity is reported in DeciSiemens/metre (dS/m). Soil will be classed according to the most saline depth. For example, if a soil is non-saline from 0-60 cm but moderately saline from 60-120 cm, the soil will be classed as moderately saline (3N).
- Strongly saline (u) soils are rated 5N with the exception of poorly and very poorly drained soils, which are rated 6NW.
- Inundation may be listed as a secondary subclass for some fluvial soils. In this case, inundation is not class determining, but may become a limitation if the soil is otherwise improved.
- Extremely calcareous loamy till soils with a high bulk density (>1.7 g/cm3) and stony 3 are rated 4DP (4RP if depth to bedrock is 50 - 100 cm).
- Stony 4 soils will be rated 4P unless their primary physical composition is sandy skeletal or their parent material is till. In either or both of these cases, the soil will be rated 5P.
- If erosion is moderate, a subclass of E is assigned as a secondary limitation, but the basic rating is not lowered. If erosion is severe, the basic soil rating is downgraded by one class, and E becomes the primary limitation. For example, if a soil has a basic rating of 4T, the presence of moderate erosion will result in a rating of 4TE. If erosion is severe, the rating will be lowered to 5ET. Erosion will be the sole limitation only if the basic rating has a subclass of X. For example, a soil with a rating of 3X will be assigned a rating of 3E if moderate erosion is present.
- The rating is not lowered from class 6 based on erosion. A rating of 6TE indicates a soil with g topography and either moderate or severe erosion.
Table 2.3 Land use data based on satellite imagery from 1993-1994
| Agriculture Capability Class | Total (ac) | Total (ha) |
| 1 | 660,782 | 267,523 |
| 2 | 7,318,412 | 2,962,920 |
| 3 | 6,039,123 | 2,444,989 |
| 4 | 4,256,620 | 1,723,328 |
| 5 | 2,555,235 | 1,034,508 |
| 6 | 1,658,669 | 671,526 |
| 7 | 512,920 | 207,660 |
| Organic | 1,912,652 | 774,353 |
| Urban & Trans. | 679,311 | 282,312 |
| Water | 493,094 | 199,633 |
| Total | 26,104,817 | 10,568,752 |
Table 2.4 Agriculture capability data based on 1:1,000,000 Canada Land Inventory map information
| Agriculture Capability Class | Limitation | Within Limits of CLI Boundary | |
| Acres | Hectares | ||
| 1 | Total Class 1 | 453,000 | 183,401 |
| 2 | I - Inundation (flooding) | 153,000 | 61,943 |
| P - Stoniness | 68,000 | 27,935 | |
| T - Topography | 1,645,000 | 665,992 | |
| W - Wetness (W, WP, WI) | 1,874,000 | 758,704 | |
| X - accumulation of two or more factors | 2,569,000 | 1,040,081 | |
| Other | 2,000 | 810 | |
| Total Class 2 | 6,311,000 | 2,555,061 | |
| 3 | I - Inundation (I, WI-IW) | 78,000 | 31,579 |
| P - Stoniness (P, FP, MP, PM, WP) | 537,000 | 217,409 | |
| T - Topography (T, TE) | 1,110,000 | 449,393 | |
| W - Wetness (W, WD, WS) | 2,471,000 | 1,000,405 | |
| M - Deficient soil moisture (M, TM) | 1,846,000 | 747,368 | |
| Other | 282,000 | 114,170 | |
| Total Class 3 | 6,324,000 | 2,560,324 | |
| 4 | I - Inundation (I, WI) | 197,000 | 79,757 |
| P - Stoniness (P, FP, PV, R, SP) | 3,127,000 | 1,265,992 | |
| T - Topography (T) | 798,000 | 323,077 | |
| W - Wetness (W, WP, WD, WS, WF) | 996,000 | 403,239 | |
| M - Deficient soil moisture (M, TM, FM, MP) | 950,000 | 384,615 | |
| Other | 285,000 | 115,385 | |
| Total Class 4 | 6,353,000 | 2,572,065 | |
| 5 | Total Class 5 | 5,556,000 | 2,249,393 |
| 6 | Total Class 6 | 5,338,000 | 2,161,134 |
| 7 | Total Class 7 | 3,096,000 | 1,253,441 |
| Total | 33,431,000 | 13,534,817 | |
Provincial soil concept
Soil is one of our most valuable natural resources. To ensure that we do not take this resource for granted, soils need to be protected and managed in a sustainable manner. Designation and proclamation of a provincial soil is one way to increase public awareness and create a greater appreciation for soils. The concept of provincial soils is practiced to a limited extent in Canada and universally in the United States. As of 2000, every state in the United States (including Guam, Puerto Rico and the US Virgin Islands) has designated a state soil. Of these, 13 have received official proclamation by their state legislature (USDA-NRCS, 2000 State Soil Planning Guide).
Table 2.5 Current status of provincial soils in Canada
| Province/Territory | Provincial Soil | Classification |
| New Brunswick | Holmesville proclaimed Feb. 1997 | Orthic Humo-Ferric Podzol |
| Prince Edward Island | Charlottetown proclaimed Nov. 1998 | Orthic Humo-Ferric Podzol |
| Manitoba | Newdale proclaimed June 2010 | Orthic Black Chernozem |
| British Columbia | TBA | Humo-Ferric Podzol |
| Alberta | Breton designated | Orthic Gray Luvisol |
| Quebec | Ste. Rosalie designated | Orthic Humic Gleysol |
| Nova Scotia | Pugwash designated | Orthic Humo-Ferric Podzol |
Newdale Series (NDL)
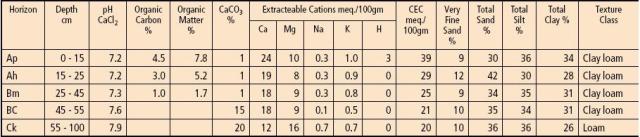
The Newdale series is characterized by an Orthic Black Chernozem solum on moderately to strongly calcareous, loamy (L, CL) morainal till of limestone, granitic and shale origin. These soils are moderately well to well-drained and occur in mid to upper slope positions of undulating to hummocky landscapes. Surface runoff is moderate to moderately rapid; permeability is moderately slow. Most of these soils are presently cultivated; they have formed under intermixed aspen grove and grassland vegetation. The Newdale solum has a very dark gray Ah horizon, commonly 10 inches (25 centimetres) thick and ranging from 6 to 14 inches (15 to 35 centimetres), a dark brown Bm horizon, 4 to 12 inches (10 to 30 centimetres) thick, and a transitional BC horizon, 1 to 6 inches (3 to 15 centimetres) thick. A lime carbonate horizon, 4 to 6 inches (10 to 15 centimetres) thick is often present in shallower soils but is not evident in deeper profiles. Its solum depth averages 23 inches (58 centimetres) and ranges from 10 to 35 inches (25 to 90 centimetres).
Table 2.6 Newdale soil analysis