Soil Management Guide
Appendices
- A. Detailed Soil Survey Protocol (1:20,000 scale)
- B. How to Use a Soil Survey Report
- C. Other Sources of Land Information
- D. Sources of dilute hydrochloric acid
- E. Drinking water quality guidelines for humans, livestock
- F. Determining Soil Texture by Feel
- G. Generalized Surface Texture of Soils in Southern Manitoba
- H. pH Status of Manitoba Soils
- I. Organic Carbon Status of Manitoba Soils
- J. Calcium Carbonate Content of Manitoba Soils
- K. Unit Conversion Table
A. Detailed Soil Survey Protocol (1:20,000 scale)
- Acquire as much of the existing background information as possible for the area to be surveyed. Reconnaissance soil maps, elevation maps and aerial photographs are all good starting points.
- Delineate landform boundaries on twin air photos viewed with stereo glasses. Aerial photographs will serve as the base map.
- Investigate soil variability within landforms by soil sampling to a depth of at least 3 feet (1 meter) at regular intervals along transects. (It is preferable to georeference these inspection sites using GPS technology). Inspections are conducted every 1/4 mile (400 metres) around the perimeter of a section and every 1/8 mile (200 metres) along two transects at the 1/4 mile (400 metres) and 3/4 mile (1200 metres) points of the section, for a total of 30 sites (see Figure 2.5).
- Classify soils in the field visually using standardized criteria for texture, colour, presence of carbonates, presence of mottles, type of parent material and landscape position. This information will assist in determining what soil horizons are present, which in turn will identify the soil series and phase present in each map unit.
- Laboratory analyses for the following factors are conducted in order to verify field data for proper soil horizon classification: (Olson, 1984, p.22)
- particle size (texture) - pipette method
- bulk density
- water retention
- cation exchange capacity
- base saturation
- sodium adsorption ratio (SAR)
- organic carbon
- calcium carbonate, gypsum
- N, P, K, S, Ca, Mg, Na, Fe, Al, NO3-, CO3=, HCO3-, Cl-, SO4= using atomic absorption and/or ion specific electrode analyses
- electrical conductivity (EC) from the saturated paste method
- pH (in CaCl2)
Refer to Methods of Soil Analysis, Parts 1 and 2, and Carter (1993) for specific analyses of the above soil properties.
- Refine map units and soil boundaries from field descriptions, laboratory data and variability observations.
- Verify soil classifications by recording all pertinent data, reviewing field and laboratory data, re-examining stereo photographs and consulting with experienced pedologists.
- Draw lines to indicate the soil boundaries and include soil symbols on the air photos or base map.
- Write soil map unit descriptions.
- Integrate all the information into a soil survey report for the area (based on Olson, 1984, pp10-11).
B. How to Use a Soil Survey Report
For more information on the legal land survey system, refer to Understanding Western Canada’s Land Survey System (McKercher and Wolfe, 1978).
- Locate the area of interest in terms of the quarter section (NW, NE, SW or SE), section, township and range.
| 31 | 32 | 33 | 34 | 35 | 36 |
| 30 | 29 | 28 | 27 | 26 | 25 |
| 19 | 20 | 21 | 22 | 23 | 24 |
| 18 | 17 | 16 | 15 | 14 | 13 |
| 7 | 8 | 9 | 10 | 11 | 12 |
| 6 | 5 | 4 | 3 | 2 | 1 |
Figure 16.1 Section Number Layout on Township Map
- Consult the index to map sheets in the soil survey report to locate the appropriate map sheet number.
- Refer to the appropriate soil map and locate the area(s) of interest on the map and identify pertinent map unit symbols (eg. NBG, PGK). Arabic numerals placed as superscripts following map symbols indicate approximate proportions of each soil type within the map unit (eg. LOP7-LLT3 indicates 70% of the map unit is a Long Plain (LOP) series; the remaining 30% of the map unit is a Lelant (LLT) series).
- Locate the desired map unit symbols in the map legend (in the appendix of the soil survey report). Symbols are listed alphabetically giving the soil name, surface texture, soil drainage, mode of origin, soil material and classification subgroup.
- A good starting point is usually in the pull-out chart of the report, which categorizes each soil series according to its parent material, texture and drainage. Tables on agricultural capability, irrigation suitability and potential environmental impact ratings are provided. Individual series descriptions and additional suitability ratings are described and provided as well.
- For further information, consult the appropriate sections in the soil report. Definitions, background information, general descriptions of individual soils and interpretive information are found in each soil survey report.
- If additional information is required, contact a soils specialist with Manitoba Agriculture, Food and Rural Initiatives.
C. Other Sources of Land Information
Table 16.1 Sources of landbase information for remote sensing
| Type of Map | Cost | Sources | Phone # |
| Black & White Aerial Photos | ~$8.50/section | Manitoba Surveys & Mapping Branch 1007 Century St. Winnipeg, MB Or visit Agri-Maps website: Manitoba Agriculture | Province of Manitoba (gov.mb.ca) | (204) 945-6666 |
| Digital Orthophotos | $25-50/quarter section | Manitoba Agricultural Services Corporation 400-50-24th St. NW, Portage la Prairie, MB R1N 3V9 | (204) 239-3246 |
| Infrared Photos | $50-300 /section | Prairie Agri-Photo Box 817, Carman, MB R0G 0J0 | (204) 745-2479 |
| Elevation Maps | N/A | Manitoba Industry, Trade & Mines Association of Manitoba Land Surveyors (for company listings) | (204) 945-6530 (204) 945-6972 |
| Yield Maps | Combine yield monitor GPS equipment Computer software | Various agriculture machinery and precision farming dealers | |
| Satellite Imagery | $825-1300 for a full Landsat 7 image field level vegetation products | Radarsat International Agri Imagis www.satshot.com Noetix Research Inc. 265 Carling Ave., Suite 403, Ottawa, ON K1S 2E1 www.noetix.on.ca |
1-888-780-6444 (701) 438-2243 (613) 236-1555 |
D. Sources of dilute hydrochloric acid
Dilute (1 N) HCl for carbonate testing can be acquired for $12-35/L from the following suppliers:
- Anachemia Science (204) 661-6734
- Fisher Scientific 1-800-234-7437
- VWR International 1-800-932-5000
E. Drinking water quality guidelines for humans, livestock
- Nitrate-nitrogen: 10 mg/L as N
- Fecal Coliform Bacteria or E. coli: 0 CFU’s/100 mL
- Total Dissolved Solids: <500 mg/L (humans); <3000 mg/L (livestock)
F. Determining Soil Texture by Feel
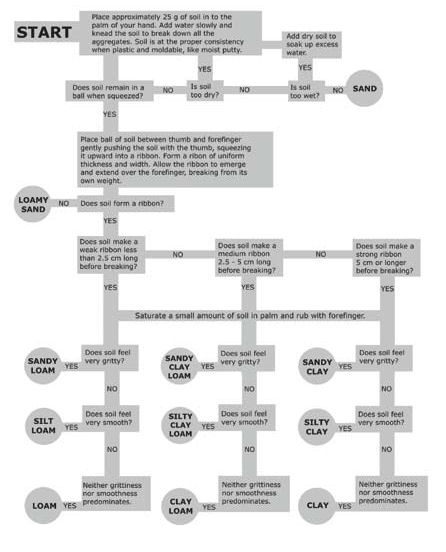
Soil texture is important as it determines such properties such as moisture holding capacity, drainage, erosion potential, and to some extent, the ability to hold and supply nutrients to the crop. Information on soil texture is available in soil survey reports, and detailed textural analysis can be requested from various soil testing laboratories.
An estimate of soil texture can be made in the field. The soil is rubbed between the fingers and thumb to estimate of the amount of sand, silt and clay particles. First, the soil needs to be wetted up to make it pliable and easily worked. Step by step instructions are given in the above flowchart.
G. Generalized Surface Texture of Soils in Southern Manitoba
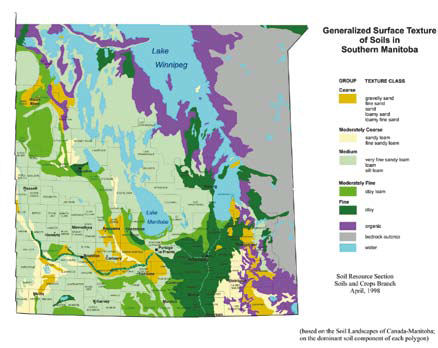
Soil texture strongly influences the soils ability to retain moisture (available water holding capacity), its general level of fertility and ease or difficulty of cultivation. Water moves easily through sandy soils therefore small amounts of moisture are retained and these soils dry out more quickly than clayey soils. Clayey soils transmit water very slowly; therefore these soils are susceptible to excess soil moisture conditions and to water erosion in undulating landscapes. Sandy soils do not retain plant nutrients as well as clayey soils and are lower in natural fertility; sandy soils often characterized by loose or single grained structure and are very susceptible to wind erosion. Medium-textured (loamy) soils are characterized by properties that fall between the extremes of coarse and fine-textured soils. They are generally fertile, able to retain sufficient moisture for plant use and are relatively easy to cultivate.
Mineral particles in soil are grouped according to size into sand (2-0.05 mm in diameter), silt (0.05- 0.002 mm) and clay (less than 0.002 mm). A soil containing nearly equal proportions of sand, silt and clay size particles is called a loam. The proportion of individual mineral particles present in a soil is referred to as texture. The presence of larger particles (diameter is greater than 2 mm) in soil is recognized as gravel, cobbles or stones.
H. pH Status of Manitoba Soils
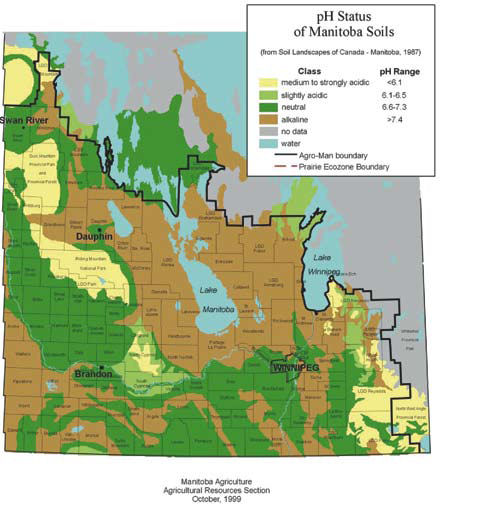
Soil pH (also referred to as soil reaction) refers to the degree of acidity or alkalinity. Soil pH is expressed by numbers from 1 to 14 on the pH scale. Most Manitoba soils range from 6.8 to 7.5.
Soil reaction influences the way minerals dissolve in soil water and thus the availability of many important nutrients for plants. It also affects the development and growth of such organisms as bacteria and fungi. At low soil pH (acid) some plant nutrients become so soluble that they leach out of the rooting zone. At high pH (alkaline), certain plant nutrients become tied up in the soil, so much so that they become deficient in the plant even when there are plenty of nutrients in the soil. Most crops prefer slightly acid to mildly alkaline conditions (pH 6.0 to 7.8).
I. Organic Carbon Status of Manitoba Soils
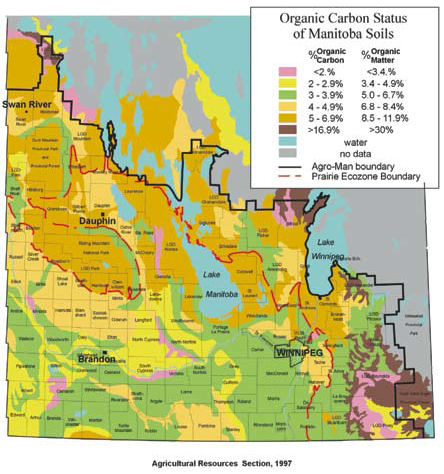
Soil carbon (organic matter) is a very important component of soil that stores and supplies plant nutrients (nitrogen, phosphorus and sulphur), and improves soil aggregation and tilth. It increases soil porosity and promotes water infiltration. Soil organic matter has a high cation-adsorption capacity and it also has an influence on the persistence, degradation, bioavailability and leachability of pesticides in soils.
The organic content of mineral soils generally ranges from 1% to 12% in the surface layers. In contrast, peat soils may contain as much as 98% organic matter. Climate and native vegetation determine the amount of organic matter in the soil. In southwestern and southern Manitoba the native vegetation is mainly grass. This results in the addition of organic matter throughout the soil and the formation of dark coloured “A” horizons. North of these areas where soils have developed under forest vegetation, leaf fall, stem decay and decomposition of mosses results in most organic matter being added to the surface and only small amounts are incorporated into the soils.
Some variability in organic matter levels within similar textural groups may be due to factors such as soil drainage conditions, topography and degree of erosion.
J. Calcium Carbonate Content of Manitoba Soils
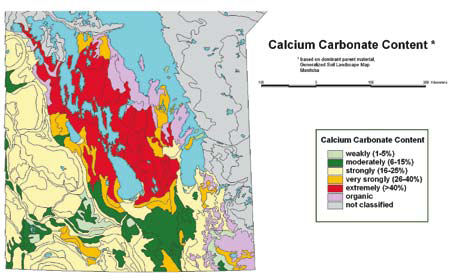
Calcium carbonates (and, to a lesser extent, magnesium carbonates) are common to most agricultural soils in Manitoba. They are derived mostly from fragments of limestone rocks. Over time, carbonates dissolve and move in the soil water.
The availability of plant nutrients is influenced by the amount of carbonates in the soil. This is a result of the effect that carbonates have on pH and of the direct effect that carbonates have on nutrient availability. Nitrogen fertilizers should be incorporated into calcareous soils to prevent nitrite accumulation or ammonium-N volatilization. Availability of phosphorous and molybdenum is reduced by high levels of calcium and magnesium which are associated with carbonates. In addition, iron, boron, zinc, and manganese deficiencies are common in soils that have a high calcium carbonate equivalent.
The calcium carbonate content of soils ranges from 0% in extremely leached soil profiles to over 40% in the high lime tills found in the Interlake region of Manitoba.
K. Unit Conversion Table
| Length | Approximate Conversion Factor | |
| centimetre (cm) | x 0.39 | inches (in) |
| metre (m) | x 3.28 | feet (ft) |
| kilometre (m) | x 0.62 | mile (mi) |
| Area | ||
| square metre (m2) | x 10.76 | square feet (ft2) |
| hectare (ha) | x 2.5 | acres (ac) |
| hectare (ha) | x 10 000 | square metres (m2) |
| square kilometer (km2) | x 0.3861 | square mile (mi2) |
| acre (ac) | x 43 560 | square feet (ft2) |
| Volume | ||
| US gallon (US gal) | x 0.83 | imperial gallon (imp. gal.) |
| litre (L) | x 0.035 | cubic feet (ft3) |
| litre (L) | x 0.22 | imperial gallon (imp.gal.) |
| cubic metre (m3) | x 35.31 | cubic feet (ft3) |
| cubic metre (m3) | x 1.31 | cubic yard (yd3) |
| cubic metre (m3) | x 220 | imperial gallon (imp. gal.) |
| cubic metre (m3) | x 1 000 | litres (L) |
| cubic foot (ft3) | x 6.24 | imperial gallon (imp. gal.) |
| dekameter3 (dam3) | x 0.81 | acre feet (ac-ft) |
| acre inch (ac-in) | x 22 615 | imperial gallon (imp. gal.) |
| Weight | ||
| kilogram (kg) | x 2.2 | pound (lb) |
| tonne (t) | x 1 000 | kilogram (kg) |
| short ton (ton) | x 0.91 | tonne (t) |
| short ton (ton) | x 2 000 | pound (lb) |
| Agricultural | ||
| kilograms per hectare (kg/ha) | x 0.89 | pounds per acre (lb/ac) |
| kilograms per tonne (kg/t) | x 2 | pounds per ton (lb/ton) |
| kilograms per 1000 litre(kg/1000L) | x 10 | pounds per 1000 gallons (lb/1000 gal.) |
| tonnes per hectare (t/ha) | x 0.45 | tons per acre (tons/ac) |
| litres per hectare (L/ha) | x 0.089 | imperial gallons per acre (imp. gal./ac) |
| litres per acre (L/ac) | x 0.22 | imperial gallons per acre (imp. gal./ac) |
| Fertilizer | ||
| Phosphorus (P) | x 2.3 | P2O5 |
| Potassium (K) | x 1.2 | K2O |